Enable Logging in Armory Continuous Deployment
Metrics and logging overview
Metrics allow you to investigate the health of your Armory Continuous Deployment system. Armory’s Observability Plugin provides a good overview of data over time about what is happening in particular services. You can monitor data points such as overall load, number of errors, and connection speeds.
Logging, on the other hand, is more useful for tracing data about what individual accounts and functions are doing within Armory Continuous Deployment. This data provides an overview on applications and errors and is primarily for auditing purposes. Armory Continuous Deployment captures logging data in the Echo service, so you can configure Echo to send logging data to your data aggregator.
Before you begin
You have set up a data aggregator with a unique endpoint. You need the endpoint and an authorization token when you enable logging in Armory Continuous Deployment. Documentation for some popular data aggregators:
Enable logging data
The following configuration example shows how to configure Echo to send data to Splunk. If you are using another data aggregator, replace the url value with the endpoint for your aggregator.
Add the rest block to the spec.spinnakerConfig.profiles.echo section of your Operator manifest.
apiVersion: spinnaker.armory.io/v1alpha2
kind: SpinnakerService
metadata:
  name: spinnaker
spec:
  spinnakerConfig:
    profiles:
      echo:
        rest:
          enabled: true
          endpoints:
          - wrap: true
            url: "http://<SERVICE_URL>:<PORT>/services/collector/event?"
            headers:
              Authorization: "<TOKEN>"
            template: '{"event":{{event}} }'
          insecure: true
SERVICE_URL: the FQDN of the service; for examplehttps://splunk.armory.io.PORT: the TCP listener port available in your aggregator.TOKEN: the authorization token for your aggregator.
The default port for Splunk’s HTTP Event Collector (HEC) is either 8088 or 8089 depending on your Splunk version. This port is used if you do not configure a TCP listener. Any TCP listener config is a custom port assignment. See the Metric data does not flow into Splunk despite setting up HEC Connection KB article for more on Splunk HEC and ports.
The SERVICE_URL:PORT can be HTTPS, which would remove the need for the insecure TOKEN. Consult your specific data aggregator provider’s documentation for how to configure an HTTPS endpoint.
Verify data flow to your aggregator
You can either wait for events to flow or run a new pipeline to test that Echo is sending logging details to your aggregator. You should now be able to search the Armory Continuous Deployment index and see events coming in. If you don’t see any data, Echo’s logs may point to the source of the problem.
Creating dashboards
After data is sent to your aggregator, you can set up dashboards to display useful data. Consult your data aggregator’s documentation for details on creating dashboards.
Splunk dashboard examples
If you are using Splunk, you can create a dashboard and then define the dashboard characteristics using a JSON file. The following examples show different dashboards created from logging data. Each example includes the JSON file that defines the dashboard characteristics.
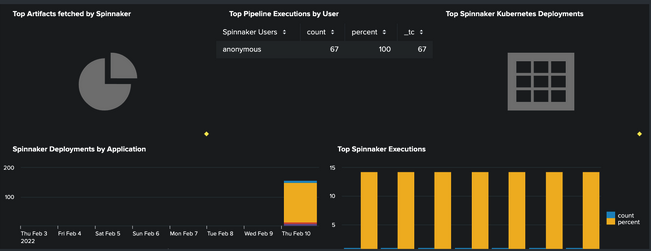
Developer insights
Show me the JSON
{
"visualizations": {
"viz_chart_1": {
"type": "viz.pie",
"options": {
"drilldown": "all",
"refresh.display": "progressbar"
},
"dataSources": {
"primary": "ds_search_2"
},
"title": "Top Artifacts fetched by Spinnaker"
},
"viz_table_1": {
"type": "splunk.table",
"options": {
"drilldown": "none",
"refresh.display": "progressbar"
},
"dataSources": {
"primary": "ds_search_3"
},
"title": "Top Pipeline Executions by User"
},
"viz_table_2": {
"type": "splunk.table",
"options": {
"drilldown": "none",
"refresh.display": "progressbar"
},
"dataSources": {
"primary": "ds_search_4"
},
"title": "Top Spinnaker Kubernetes Deployments"
},
"viz_chart_2": {
"type": "viz.column",
"options": {
"axisLabelsX.majorLabelStyle.rotation": 0,
"axisTitleX.visibility": "visible",
"axisTitleY.visibility": "visible",
"axisTitleY2.visibility": "visible",
"axisY.abbreviation": "none",
"axisY.scale": "linear",
"chart.showDataLabels": "none",
"chart.stackMode": "stacked",
"drilldown": "all",
"legend.placement": "bottom",
"refresh.display": "progressbar",
"trellis.enabled": 0
},
"dataSources": {
"primary": "ds_search_5"
},
"title": "Spinnaker Deployments by Application"
},
"viz_chart_3": {
"type": "viz.column",
"options": {
"chart.stackMode": "default",
"drilldown": "none",
"refresh.display": "progressbar"
},
"dataSources": {
"primary": "ds_search_6"
},
"title": "Top Spinnaker Executions"
}
},
"dataSources": {
"ds_search_1": {
"type": "ds.search",
"options": {
"query": "index=Spinnaker | fields content.execution.application | dedup content.execution.application | table content.execution.application | rename content.execution.application as \"AppName\"",
"queryParameters": {
"earliest": "0"
}
}
},
"ds_search_2": {
"type": "ds.search",
"options": {
"query": "index = Spinnaker \"event.details.type\"=\"orca:pipeline:starting\" event.content.execution.application=$field2$ | top limit=20 \"event.content.execution.stages{}.context.inputArtifacts{}.artifact.name\" | rename event.content.execution.stages{}.context.inputArtifacts{}.artifact.name as \"Artifact Name\"",
"queryParameters": {
"earliest": "$field1.earliest$",
"latest": "$field1.latest$"
}
}
},
"ds_search_3": {
"type": "ds.search",
"options": {
"query": "index=\"Spinnaker\" event.content.execution.application=$field2$ | top limit=20 \"event.content.execution.authentication.user\" | rename event.content.execution.authentication.user as \"Spinnaker Users\"",
"queryParameters": {
"earliest": "$field1.earliest$",
"latest": "$field1.latest$"
}
}
},
"ds_search_4": {
"type": "ds.search",
"options": {
"query": "index=Spinnaker event.content.execution.application=$field2$ | top limit=20 \"event.content.execution.stages{}.context.deployedManifests{}.name\" | rename event.content.execution.stages{}.context.deployedManifests{}.name as \"Top Deployed Manifests\"",
"queryParameters": {
"earliest": "$field1.earliest$",
"latest": "$field1.latest$"
}
}
},
"ds_search_5": {
"type": "ds.search",
"options": {
"query": "index=Spinnaker event.content.execution.application=$field2$ | fields event.content.execution.application | timechart count by event.content.execution.application limit=10 usenull=f",
"queryParameters": {
"earliest": "$field1.earliest$",
"latest": "$field1.latest$"
}
}
},
"ds_search_6": {
"type": "ds.search",
"options": {
"query": "index=Spinnaker \"event.details.type\"=\"orca:pipeline:starting\" event.content.execution.application=$field2$ | top limit=20 \"event.content.execution.name\" | rename event.content.execution.name as \"Top Spinnaker Executions\"",
"queryParameters": {
"earliest": "$field1.earliest$",
"latest": "$field1.latest$"
}
}
}
},
"defaults": {
"dataSources": {
"ds.search": {
"options": {
"queryParameters": {}
}
}
}
},
"inputs": {
"input_1": {
"type": "input.timerange",
"title": "Select Time",
"options": {
"token": "field1",
"defaultValue": "-7d@h,now"
}
},
"input_2": {
"type": "input.dropdown",
"title": "Spinnaker Application Name",
"options": {
"token": "field2",
"defaultValue": "*",
"items": [
{
"value": "*",
"label": "All"
}
]
},
"encoding": {
"value": "primary.AppName",
"label": "primary.AppName"
},
"dataSources": {
"primary": "ds_search_1"
}
}
},
"layout": {
"type": "absolute",
"options": {
"submitButton": false,
"display": "auto-scale",
"height": 500
},
"structure": [
{
"item": "viz_chart_1",
"type": "block",
"position": {
"x": 0,
"y": 0,
"w": 400,
"h": 250
}
},
{
"item": "viz_table_1",
"type": "block",
"position": {
"x": 400,
"y": 0,
"w": 400,
"h": 250
}
},
{
"item": "viz_table_2",
"type": "block",
"position": {
"x": 800,
"y": 0,
"w": 400,
"h": 250
}
},
{
"item": "viz_chart_2",
"type": "block",
"position": {
"x": 0,
"y": 250,
"w": 600,
"h": 250
}
},
{
"item": "viz_chart_3",
"type": "block",
"position": {
"x": 600,
"y": 250,
"w": 600,
"h": 250
}
}
],
"globalInputs": [
"input_1",
"input_2"
]
},
"description": "",
"title": "Developer Insights"
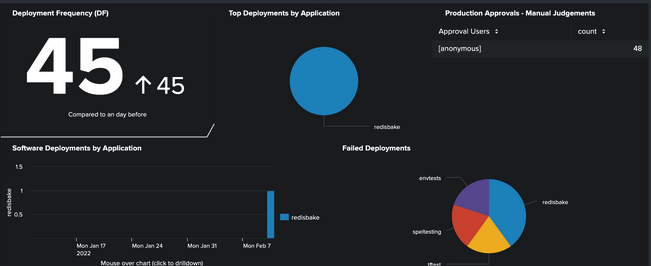
}Software deployments
Show me the JSON
{
"visualizations": {
"viz_single_1": {
"type": "splunk.singlevalue",
"options": {
"drilldown": "all",
"refresh.display": "progressbar",
"trendInterval": "-24h",
"underLabel": "Compared to a day before",
"shouldUseThousandSeparators": true
},
"dataSources": {
"primary": "ds_search_1"
},
"title": "Deployment Frequency (DF)"
},
"viz_chart_1": {
"type": "viz.pie",
"options": {
"drilldown": "none"
},
"dataSources": {
"primary": "ds_search_2"
},
"title": "Top Deployments by Application"
},
"viz_table_1": {
"type": "splunk.table",
"options": {
"drilldown": "none",
"refresh.display": "progressbar"
},
"dataSources": {
"primary": "ds_search_3"
},
"title": "Production Approvals - Manual Judgements"
},
"viz_chart_2": {
"type": "viz.column",
"options": {
"axisTitleX.text": "Mouse over chart (click to drilldown)",
"drilldown": "all"
},
"dataSources": {
"primary": "ds_search_4"
},
"title": "Software Deployments by Application"
},
"viz_Cgz4gtYq": {
"type": "viz.pie",
"dataSources": {
"primary": "ds_1xOoneRR"
},
"title": "Failed Deployments"
}
},
"dataSources": {
"ds_search_1": {
"type": "ds.search",
"options": {
"query": "index=Spinnaker \"event.details.type\"=\"orca:task:complete\" | fields event.details.type | timechart count",
"queryParameters": {
"earliest": "$field1.earliest$",
"latest": "$field1.latest$"
}
}
},
"ds_search_2": {
"type": "ds.search",
"options": {
"query": "index=Spinnaker \"event.details.type\"=\"orca:pipeline:complete\"| top limit=20 \"event.details.application\"",
"queryParameters": {
"earliest": "$field1.earliest$",
"latest": "$field1.latest$"
}
}
},
"ds_search_3": {
"type": "ds.search",
"options": {
"query": "index=Spinnaker \"event.content.execution.stages{}.name\"=\"Manual Judgment\" | stats count by event.content.execution.trigger.user | rename event.content.execution.trigger.user as \"Approval Users\"",
"queryParameters": {
"earliest": "$field1.earliest$",
"latest": "$field1.latest$"
}
}
},
"ds_search_4": {
"type": "ds.search",
"options": {
"query": "index=Spinnaker \"event.details.type\"=\"orca:pipeline:complete\"| timechart count by event.details.application limit=10",
"queryParameters": {
"earliest": "$field1.earliest$",
"latest": "$field1.latest$"
}
}
},
"ds_1xOoneRR": {
"type": "ds.search",
"options": {
"queryParameters": {
"earliest": "$field1.earliest$",
"latest": "$field1.latest$"
},
"query": "index=Spinnaker \"event.details.type\"=\"orca:pipeline:failed\"| top limit=20 \"event.details.application\""
},
"name": "Failed Deployments"
}
},
"defaults": {
"dataSources": {
"ds.search": {
"options": {
"queryParameters": {}
}
}
}
},
"inputs": {
"input_1": {
"type": "input.timerange",
"title": "Select Time",
"options": {
"token": "field1",
"defaultValue": "-30d@d,now"
}
}
},
"layout": {
"type": "absolute",
"options": {
"submitButton": false,
"display": "auto-scale",
"height": 500
},
"structure": [
{
"item": "viz_single_1",
"type": "block",
"position": {
"x": 0,
"y": 0,
"w": 400,
"h": 250
}
},
{
"item": "viz_chart_1",
"type": "block",
"position": {
"x": 400,
"y": 0,
"w": 400,
"h": 250
}
},
{
"item": "viz_table_1",
"type": "block",
"position": {
"x": 800,
"y": 0,
"w": 400,
"h": 250
}
},
{
"item": "viz_chart_2",
"type": "block",
"position": {
"x": 0,
"y": 250,
"w": 610,
"h": 250
}
},
{
"item": "viz_Cgz4gtYq",
"type": "block",
"position": {
"x": 610,
"y": 250,
"w": 590,
"h": 250
}
}
],
"globalInputs": [
"input_1"
]
},
"description": "",
"title": "Software Deployments"
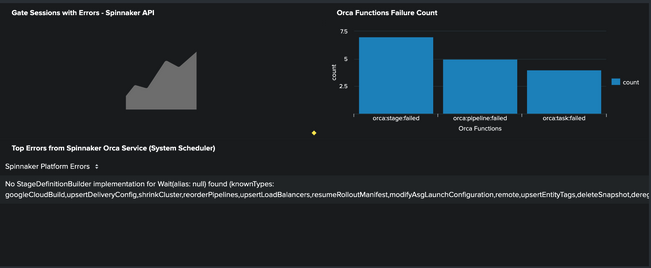
}Armory Continuous Deployment platform
Show me the JSON
{
"visualizations": {
"viz_chart_1": {
"type": "viz.area",
"options": {
"chart.stackMode": "stacked",
"drilldown": "all"
},
"dataSources": {
"primary": "ds_search_1"
},
"title": "Gate Sessions with Errors - Spinnaker API"
},
"viz_chart_2": {
"type": "viz.column",
"options": {
"chart.stackMode": "stacked",
"refresh.display": "progressbar"
},
"dataSources": {
"primary": "ds_search_2"
},
"title": "Orca Functions Failure Count"
},
"viz_table_1": {
"type": "splunk.table",
"options": {
"drilldown": "row",
"rowNumbers": true
},
"dataSources": {
"primary": "ds_search_3"
},
"title": "Top Errors from Spinnaker Orca Service (System Scheduler)"
}
},
"dataSources": {
"ds_search_1": {
"type": "ds.search",
"options": {
"query": "index=Spinnaker clouddriver error| timechart count by event.content.context.exception.details.error limit=10 usenull=0",
"queryParameters": {
"earliest": "$field1.earliest$",
"latest": "$field1.latest$"
}
}
},
"ds_search_2": {
"type": "ds.search",
"options": {
"query": "index=Spinnaker \"event.details.type\"=\"orca:*:failed\" | stats count by event.details.type | sort -count | rename event.details.type as \"Orca Functions\"",
"queryParameters": {
"earliest": "$field1.earliest$",
"latest": "$field1.latest$"
}
}
},
"ds_search_3": {
"type": "ds.search",
"options": {
"query": "index=Spinnaker \"event.details.type\"=\"orca:*:failed\"| top limit=20 \"event.content.context.exception.details.errors{}\" | rename event.content.context.exception.details.errors{} as \"Spinnaker Platform Errors\"",
"queryParameters": {
"earliest": "$field1.earliest$",
"latest": "$field1.latest$"
}
}
}
},
"defaults": {
"dataSources": {
"ds.search": {
"options": {
"queryParameters": {}
}
}
}
},
"inputs": {
"input_1": {
"type": "input.timerange",
"title": "Select Time",
"options": {
"token": "field1",
"defaultValue": "-7d@h,now"
}
}
},
"layout": {
"type": "absolute",
"options": {
"submitButton": false,
"display": "auto-scale",
"height": 500
},
"structure": [
{
"item": "viz_chart_1",
"type": "block",
"position": {
"x": 0,
"y": 0,
"w": 600,
"h": 250
}
},
{
"item": "viz_chart_2",
"type": "block",
"position": {
"x": 600,
"y": 0,
"w": 600,
"h": 250
}
},
{
"item": "viz_table_1",
"type": "block",
"position": {
"x": 0,
"y": 250,
"w": 1200,
"h": 250
}
}
],
"globalInputs": [
"input_1"
]
},
"description": "",
"title": "Spinnaker Platform"
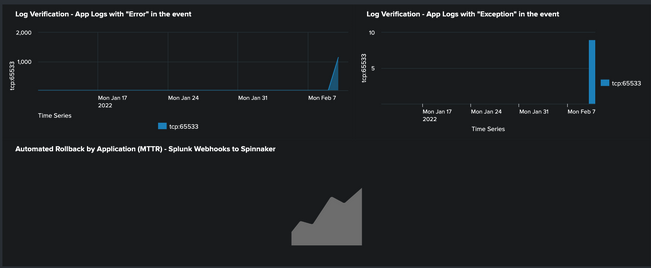
}Continuous verification
Show me the JSON
{
"visualizations": {
"viz_chart_1": {
"type": "viz.area",
"options": {
"axisTitleX.text": "Time Series",
"drilldown": "all",
"legend.placement": "bottom",
"refresh.display": "progressbar"
},
"dataSources": {
"primary": "ds_search_3"
},
"title": "Log Verification - App Logs with \"Error\" in the event"
},
"viz_chart_2": {
"type": "viz.column",
"options": {
"axisTitleX.text": "Time Series",
"drilldown": "all",
"refresh.display": "progressbar"
},
"dataSources": {
"primary": "ds_search_4"
},
"title": "Log Verification - App Logs with \"Exception\" in the event"
},
"viz_chart_4": {
"type": "viz.area",
"options": {
"drilldown": "none"
},
"dataSources": {
"primary": "ds_search_7"
},
"title": "Automated Rollback by Application (MTTR) - Splunk Webhooks to Spinnaker"
}
},
"dataSources": {
"ds_search_1": {
"type": "ds.search",
"options": {
"query": "index=* | fields index | dedup index | table index",
"queryParameters": {
"earliest": "0"
}
}
},
"ds_search_2": {
"type": "ds.search",
"options": {
"query": "index=$field2$ | fields sourcetype | dedup sourcetype | table sourcetype",
"queryParameters": {
"earliest": "0"
}
}
},
"ds_search_3": {
"type": "ds.search",
"options": {
"query": "index=$field2$ sourcetype=$field3$ | fields index, sourcetype, source | timechart count as events by source",
"queryParameters": {
"earliest": "$field1.earliest$",
"latest": "$field1.latest$"
}
}
},
"ds_search_4": {
"type": "ds.search",
"options": {
"query": "index=$field2$ sourcetype=$field3$ exception | timechart count as events by source",
"queryParameters": {
"earliest": "$field1.earliest$",
"latest": "$field1.latest$"
}
}
},
"ds_search_5": {
"type": "ds.search",
"options": {
"query": "index=Spinnaker status=5* OR status=4* | fields status, index, sourcetype | timechart count by status",
"queryParameters": {
"earliest": "$field1.earliest$",
"latest": "$field1.latest$"
}
}
},
"ds_search_6": {
"type": "ds.search",
"options": {
"query": "index=_internal sourcetype=scheduler search_type=scheduled alert_actions!=\"\" app=\"TA-Spinnaker\" | table _time, savedsearch_name, app, alert_actions, run_time",
"queryParameters": {
"earliest": "$field1.earliest$",
"latest": "$field1.latest$"
}
}
},
"ds_search_7": {
"type": "ds.search",
"options": {
"query": "index=Spinnaker \"event.content.execution.trigger.payload.search_name\"=Rollback | timechart count by event.details.application",
"queryParameters": {
"earliest": "$field1.earliest$",
"latest": "$field1.latest$"
}
}
}
},
"defaults": {
"dataSources": {
"ds.search": {
"options": {
"queryParameters": {}
}
}
}
},
"inputs": {
"input_1": {
"type": "input.timerange",
"title": "Select your time range",
"options": {
"token": "field1",
"defaultValue": "-30d@d,now"
}
},
"input_2": {
"type": "input.dropdown",
"title": "Find Application Index",
"options": {
"token": "field2",
"defaultValue": "*",
"items": [
{
"value": "*",
"label": "All"
}
]
},
"encoding": {
"value": "primary.index",
"label": "primary.index"
},
"dataSources": {
"primary": "ds_search_1"
}
},
"input_3": {
"type": "input.dropdown",
"title": "Find Application SourceType",
"options": {
"token": "field3",
"defaultValue": "*",
"items": [
{
"value": "*",
"label": "All"
}
]
},
"encoding": {
"value": "primary.sourcetype",
"label": "primary.sourcetype"
},
"dataSources": {
"primary": "ds_search_2"
}
}
},
"layout": {
"type": "absolute",
"options": {
"submitButton": false,
"display": "auto-scale",
"height": 500
},
"structure": [
{
"item": "viz_chart_1",
"type": "block",
"position": {
"x": 0,
"y": 0,
"w": 650,
"h": 250
}
},
{
"item": "viz_chart_2",
"type": "block",
"position": {
"x": 650,
"y": 0,
"w": 550,
"h": 250
}
},
{
"item": "viz_chart_4",
"type": "block",
"position": {
"x": 0,
"y": 250,
"w": 1200,
"h": 250
}
}
],
"globalInputs": [
"input_1",
"input_2",
"input_3"
]
},
"description": "",
"title": "Continuous Verification"
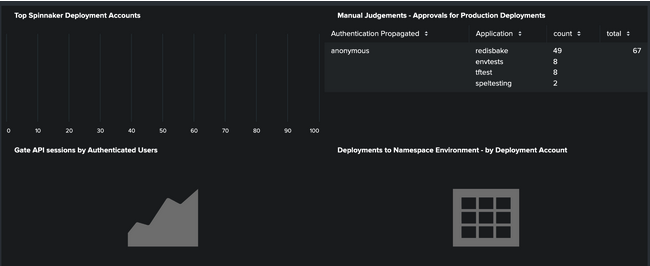
}Compliance center
Show me the JSON
{
	"visualizations": {
		"viz_chart_1": {
			"type": "viz.bar",
			"options": {
				"drilldown": "none",
				"refresh.display": "progressbar"
			},
			"dataSources": {
				"primary": "ds_search_1"
			},
			"title": "Top Spinnaker Deployment Accounts"
		},
		"viz_table_1": {
			"type": "splunk.table",
			"options": {
				"drilldown": "none",
				"refresh.display": "progressbar"
			},
			"dataSources": {
				"primary": "ds_search_2"
			},
			"title": "Manual Judgements - Approvals for Production Deployments"
		},
		"viz_chart_2": {
			"type": "viz.area",
			"options": {
				"drilldown": "none"
			},
			"dataSources": {
				"primary": "ds_search_3"
			},
			"title": "Gate API sessions by Authenticated Users"
		},
		"viz_table_2": {
			"type": "splunk.table",
			"options": {
				"drilldown": "none"
			},
			"dataSources": {
				"primary": "ds_search_4"
			},
			"title": "Deployments to Namespace Environment - by Deployment Account"
		}
	},
	"dataSources": {
		"ds_search_1": {
			"type": "ds.search",
			"options": {
				"query": "index=Spinnaker \"event.details.type\"=\"orca:pipeline:starting\" | timechart count by event.content.execution.stages{}.context.account limit=10 usenull=f",
				"queryParameters": {
					"earliest": "$field1.earliest$",
					"latest": "$field1.latest$"
				}
			}
		},
		"ds_search_2": {
			"type": "ds.search",
			"options": {
				"query": "index=Spinnaker | stats count by event.content.execution.authentication.user, event.details.application | sort -count | stats list(event.details.application) as \"Application\", list(count) as count, sum(count) as total by event.content.execution.authentication.user | sort -total | rename event.content.execution.authentication.user as \"Authentication Propagated\"",
				"queryParameters": {
					"earliest": "$field1.earliest$",
					"latest": "$field1.latest$"
				}
			}
		},
		"ds_search_3": {
			"type": "ds.search",
			"options": {
				"query": "index=Spinnaker \"event.details.source\"=gate event.content.user=!anonymous | timechart count by event.content.user",
				"queryParameters": {
					"earliest": "$field1.earliest$",
					"latest": "$field1.latest$"
				}
			}
		},
		"ds_search_4": {
			"type": "ds.search",
			"options": {
				"query": "index=Spinnaker | stats count by event.content.execution.stages{}.context.account, event.content.context.kato.tasks{}.resultObjects{}.manifests{}.metadata.namespace | sort -count | stats list(event.content.context.kato.tasks{}.resultObjects{}.manifests{}.metadata.namespace) as \"Deployment Namespaces\", list(count) as count, sum(count) as total by event.content.execution.stages{}.context.account | sort -total | rename event.content.execution.stages{}.context.account as \"Spinnaker Deployment Accounts\"",
				"queryParameters": {
					"earliest": "$field1.earliest$",
					"latest": "$field1.latest$"
				}
			}
		}
	},
	"defaults": {
		"dataSources": {
			"ds.search": {
				"options": {
					"queryParameters": {}
				}
			}
		}
	},
	"inputs": {
		"input_1": {
			"type": "input.timerange",
			"title": "Select Time",
			"options": {
				"token": "field1",
				"defaultValue": "-30d@d,now"
			}
		}
	},
	"layout": {
		"type": "absolute",
		"options": {
			"submitButton": false,
			"display": "auto-scale",
			"height": 500
		},
		"structure": [
			{
				"item": "viz_chart_1",
				"type": "block",
				"position": {
					"x": 0,
					"y": 0,
					"w": 600,
					"h": 250
				}
			},
			{
				"item": "viz_table_1",
				"type": "block",
				"position": {
					"x": 600,
					"y": 0,
					"w": 600,
					"h": 250
				}
			},
			{
				"item": "viz_chart_2",
				"type": "block",
				"position": {
					"x": 0,
					"y": 250,
					"w": 600,
					"h": 250
				}
			},
			{
				"item": "viz_table_2",
				"type": "block",
				"position": {
					"x": 600,
					"y": 250,
					"w": 600,
					"h": 250
				}
			}
		],
		"globalInputs": [
			"input_1"
		]
	},
	"description": "",
	"title": "Compliance Center"
}
Feedback
Was this page helpful?
Thank you for letting us know!
Sorry to hear that. Please tell us how we can improve.
Last modified August 18, 2023: (02b163b7)