Monitor Armory Continuous Deployment with Prometheus
Overview
Armory recommends monitoring the health of Armory Continuous Deployment in every production instance. This document describes how to set up a basic Prometheus and Grafana stack as well as enable monitoring for the Armory Continuous Deployment services.
Additional Prometheus and Grafana configuration is necessary to make them production-grade, and this configuration is not a part of this document. Also note that monitoring the Pipelines-as-Code service (Dinghy) and the Terraform Integration service (Terraformer) are not discussed on this page.
Before you begin
- You are familiar with Prometheus and Grafana
- Armory Continuous Deployment is deployed in the
spinnakernamespace - Prometheus and Grafana are deployed in the
monitoringnamespace - You have configured monitoring using the Observability Plugin.
Use kube-prometheus to create a monitoring stack
You can skip this section if you already have a monitoring stack.
A quick and easy way to configure a cluster monitoring solution is to use kube-prometheus. This project creates a monitoring stack that includes cluster monitoring with Prometheus and dashboards with Grafana.
To create the stack, follow the kube-prometheus quick start instructions beginning with the Compatibility Matrix section.
After you complete the instructions, you have pods running in the monitoring namespace:
% kubectl get pods --namespace monitoring

NAME                                  READY   STATUS    RESTARTS   AGE
alertmanager-main-0                   2/2     Running   0          44s
alertmanager-main-1                   2/2     Running   0          44s
alertmanager-main-2                   2/2     Running   0          44s
grafana-77978cbbdc-x5rsq              1/1     Running   0          40s
kube-state-metrics-7f6d7b46b4-crzx2   3/3     Running   0          40s
node-exporter-nrc88                   2/2     Running   0          41s
prometheus-adapter-68698bc948-bl7p8   1/1     Running   0          40s
prometheus-k8s-0                      3/3     Running   1          39s
prometheus-k8s-1                      3/3     Running   1          39s
prometheus-operator-6685db5c6-qfpbj   1/1     Running   0          106s
Access the Prometheus web interface by using the kubectl port-forward command. If you want to expose this interface for others to use, create an ingress service. Make sure you nable security controls that follow Prometheus best practices.
% kubectl --namespace monitoring port-forward svc/prometheus-k8s 9090 &
Navigate to http://localhost:9090/targets.
Grant Prometheus RBAC permissions
There are two steps to configure Prometheus to monitor Armory Continuous Deployment:
- Add permissions for Prometheus to talk to the Spinnaker namespace
- Configure Prometheus to discover the Armory Continuous Deployment endpoints
Add permissions for Prometheus by applying the following configuration to your cluster. You can learn more about this process on the Prometheus Operator homepage.
Example config:
apiVersion: rbac.authorization.k8s.io/v1beta1
kind: ClusterRoleBinding
metadata:
  # name can be either prometheus or prometheus-k8s depending on the version of the prometheus-operator
  name: prometheus
roleRef:
  apiGroup: rbac.authorization.k8s.io
  kind: ClusterRole
  # name can be either prometheus or prometheus-k8s depending on the version of the prometheus-operator
  name: prometheus
subjects:
  - kind: ServiceAccount
    # name can be either prometheus or prometheus-k8s depending on the version of the prometheus-operator
    name: prometheus-k8s
    namespace: monitoring
---
apiVersion: rbac.authorization.k8s.io/v1beta1
kind: ClusterRole
metadata:
  # name can be either prometheus or prometheus-k8s depending on the version of the prometheus-operator
  name: prometheus
rules:
- apiGroups: [""]
  resources:
  - nodes
  - nodes/metrics
  - services
  - endpoints
  - pods
  verbs: ["get", "list", "watch"]
- apiGroups: [""]
  resources:
  - configmaps
  verbs: ["get"]
- nonResourceURLs: ["/metrics"]
  verbs: ["get"]
---
apiVersion: v1
kind: ServiceAccount
metadata:
  namespace: monitoring
  # name can be either prometheus or prometheus-k8s depending on the version of the prometheus-operator
  name: prometheus-k8s
Add the ServiceMonitor
Prometheus Operator uses a “ServiceMonitor” to add targets that get scraped for monitoring. The following example config shows how to monitor pods that are using the Observability Plugin to expose the aop-prometheus endpoint. Note that the example contains both the exclusion of certain services (such as Redis) and changes to the Gate endpoint to show you different options.
These are examples of potential configurations. Use them as a starting point. Armory recommends that you understand how they operate and find services. Adapt them to your environment.
apiVersion: monitoring.coreos.com/v1
kind: ServiceMonitor
metadata:
  labels:
    app: spin
    # This label is here to match the prometheus operator serviceMonitorSelector attribute
    # prometheus.prometheusSpec.serviceMonitorSelector. For more information, see
    # https://github.com/helm/charts/tree/master/stable/prometheus-operator
    release: prometheus-operator
  name: spinnaker-all-metrics
  namespace: spinnaker
spec:
  endpoints:
  - interval: 10s
    path: /aop-prometheus
  selector:
    matchExpressions:
    - key: cluster
      operator: NotIn
      values:
      - spin-gate
      - spin-gate-api
      - spin-gate-custom
      - spin-deck
      - spin-deck-custom
      - spin-redis
      - spin-terraformer
      - spin-dinghy
    matchLabels:
      app: spin
The example excludes Gate, the API service since Gate restricts access to the endpoints unless authenticated (excluding health).
The following example is for a service monitor for Gate on a different path and using TLS.
Once these are applied, you can port forward prometheus and validate that prometheus has discovered and scraped targets as appropriate.
apiVersion: monitoring.coreos.com/v1
kind: ServiceMonitor
metadata:
  name: spinnaker-internal-metrics
  namespace: spinnaker
  labels:
    app: spin
    # This label is here to match the prometheus operator serviceMonitorSelector attribute
    # prometheus.prometheusSpec.serviceMonitorSelector
    # https://github.com/helm/charts/tree/master/stable/prometheus-operator
    release: prometheus-operator
spec:
  selector:
    matchLabels:
      cluster: spin-gate
  endpoints:
  - interval: 10s
    path: "/api/v1/aop-prometheus"
    # If Prometheus returns the error "http: server gave HTTP response to HTTPS client" then
    # replace scheme with targetPort:
    # Note that "port" is string only. "targetPort" is integer or string.
    # For example, targetPort: 8084
    scheme: "https"
    tlsConfig:
      insecureSkipVerify: true
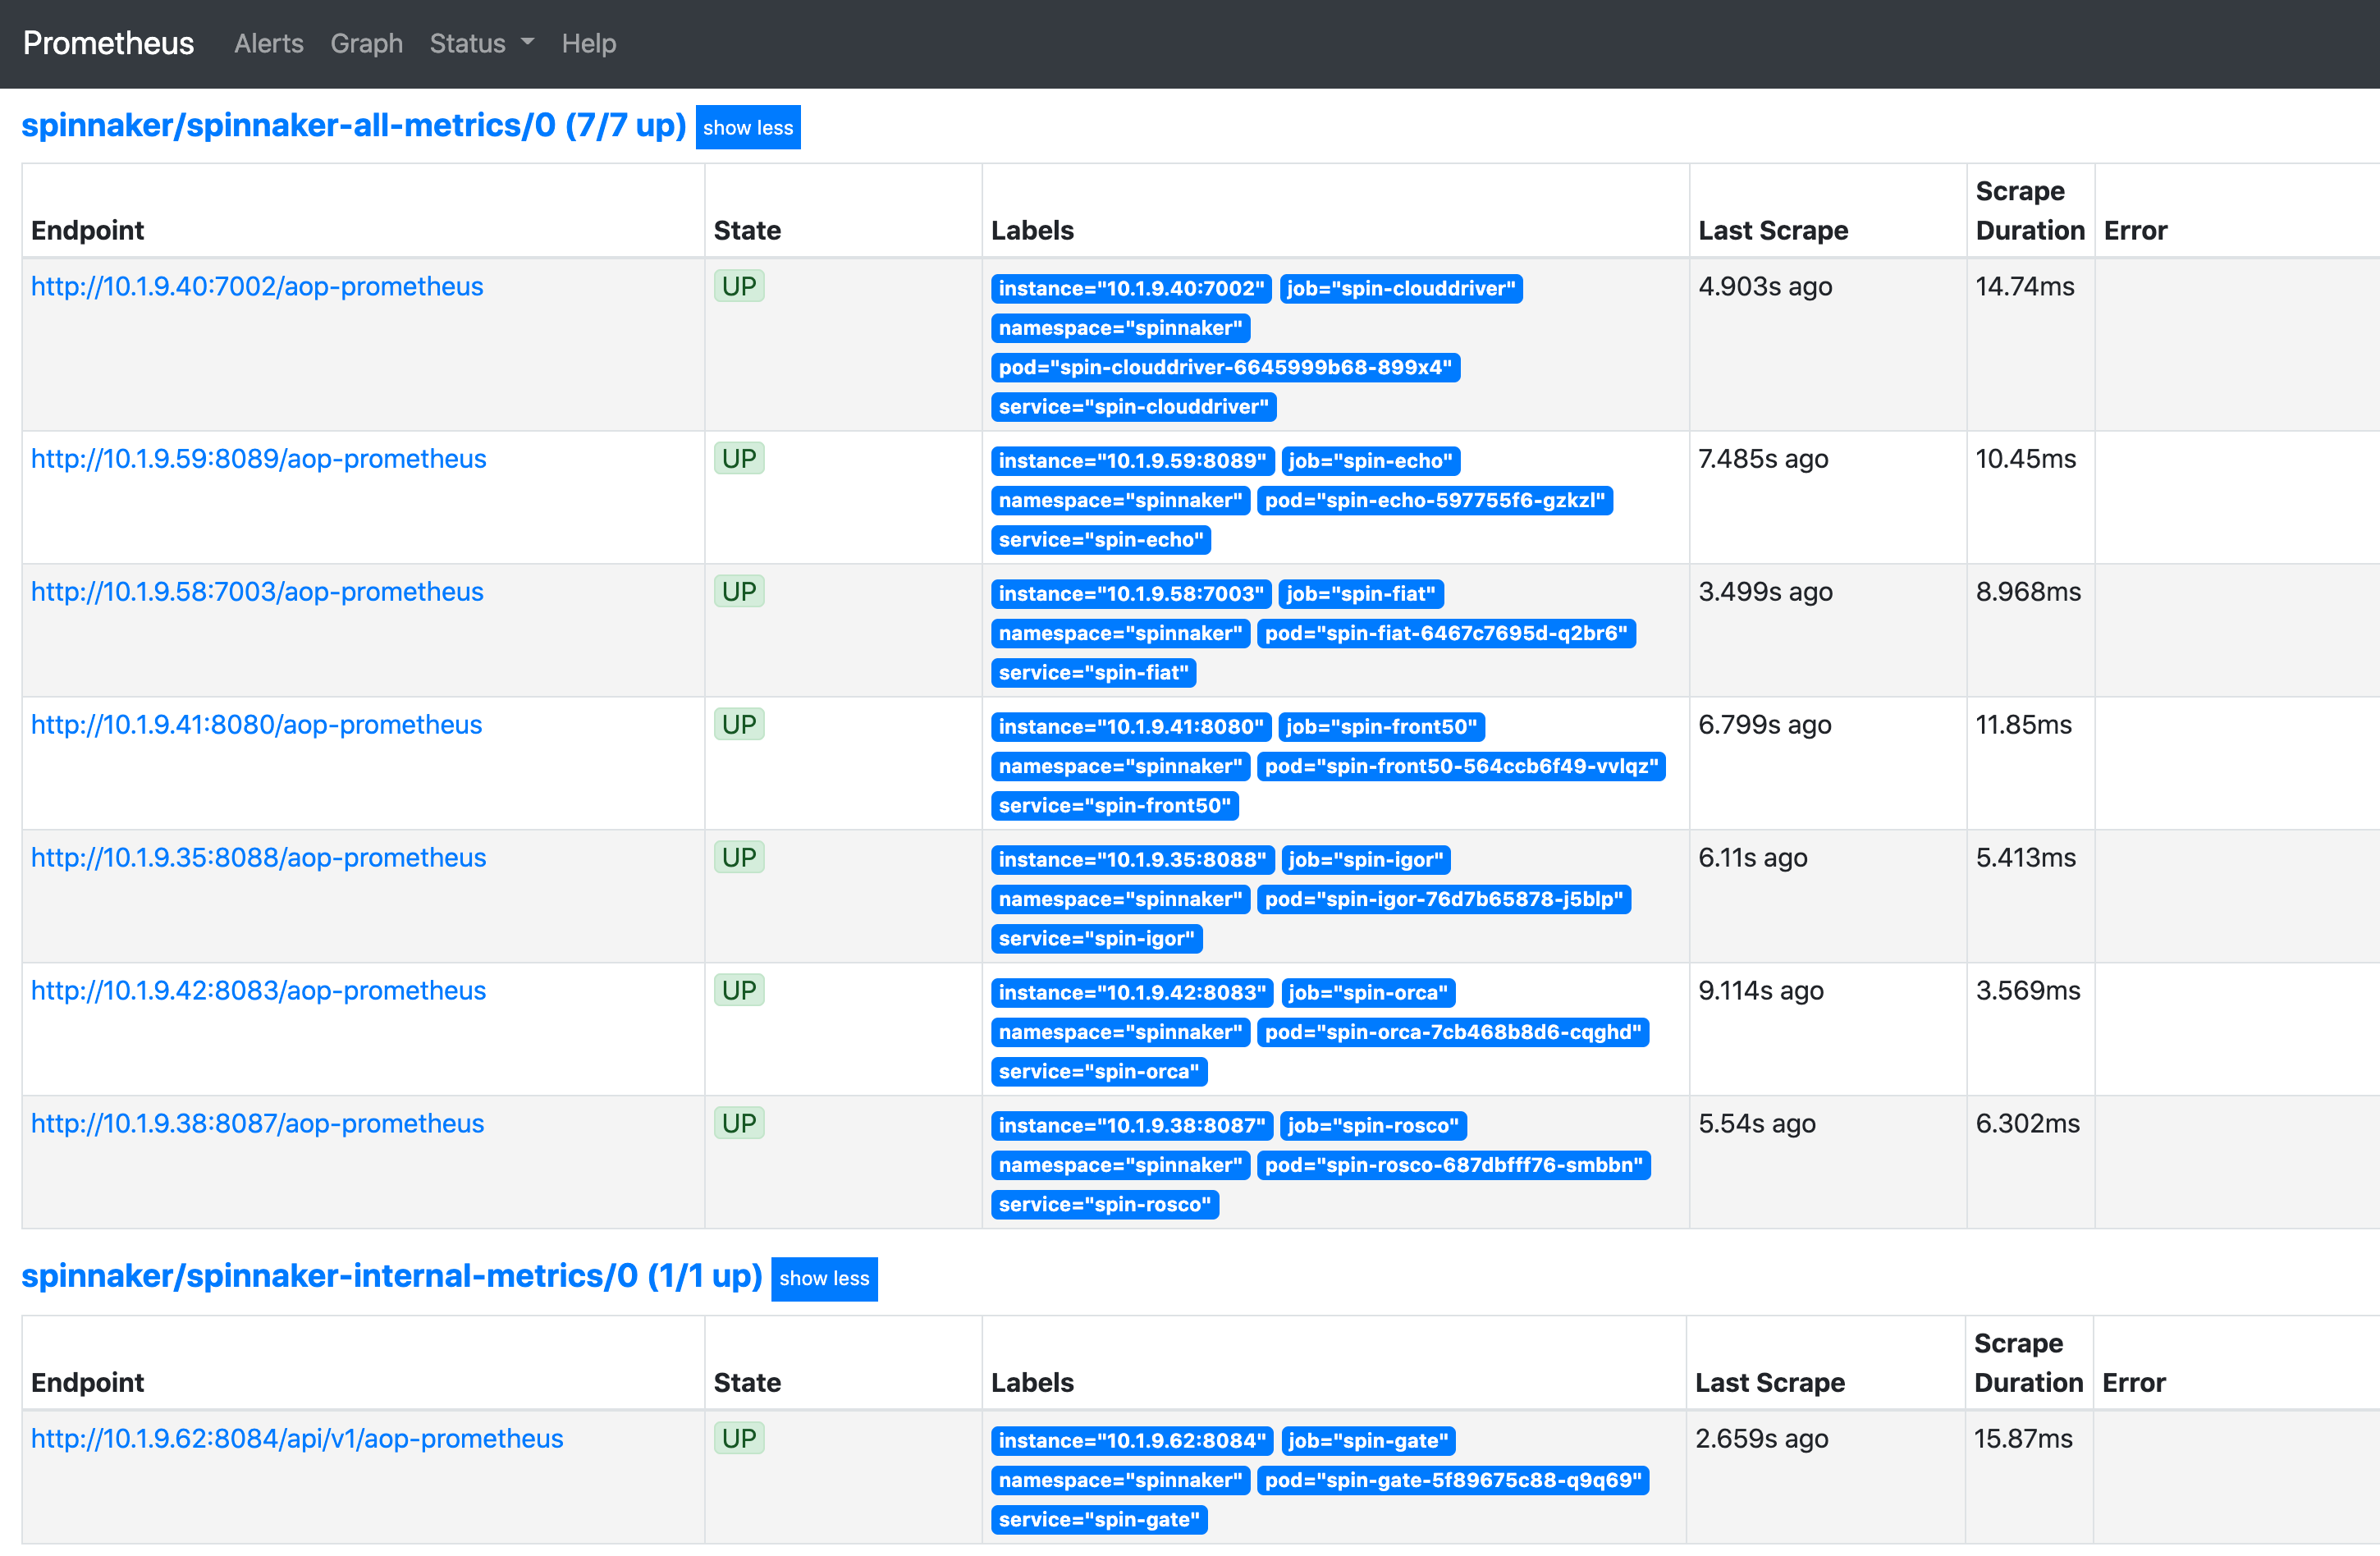
Check for Armory Continuous Deployment targets in Prometheus
After applying these changes, you should be able to see Armory Continuous Deployment targets in Prometheus. It may take 3 to 5 minutes for this to show up depending on where Prometheus is in its config polling interval.
Access Grafana
Configure port forwarding for Grafana:
$ kubectl --namespace monitoring port-forward svc/grafana 3000
Access the Grafana web interface via http://localhost:3000 and use the default Grafana username and password of admin:admin.
Add Armory dashboards to Grafana
Armory provides some sample dashboards (in JSON format) that you can import into Grafana as a starting point for metrics to graph for monitoring. Armory has additional dashboards that are available to Armory customers. You can skip this section if you are a Grafana expert.
To import the sample dashboards, perform the following steps:
- Git clone this repo to your local workstation: (https://github.com/uneeq-oss/spinnaker-mixin)
- Access the Grafana web interface (as shown above)
- Navigate to Dashboards then Manage
- Click on the Import button
- Upload the one or more of the sample dashboard files from the repo you cloned
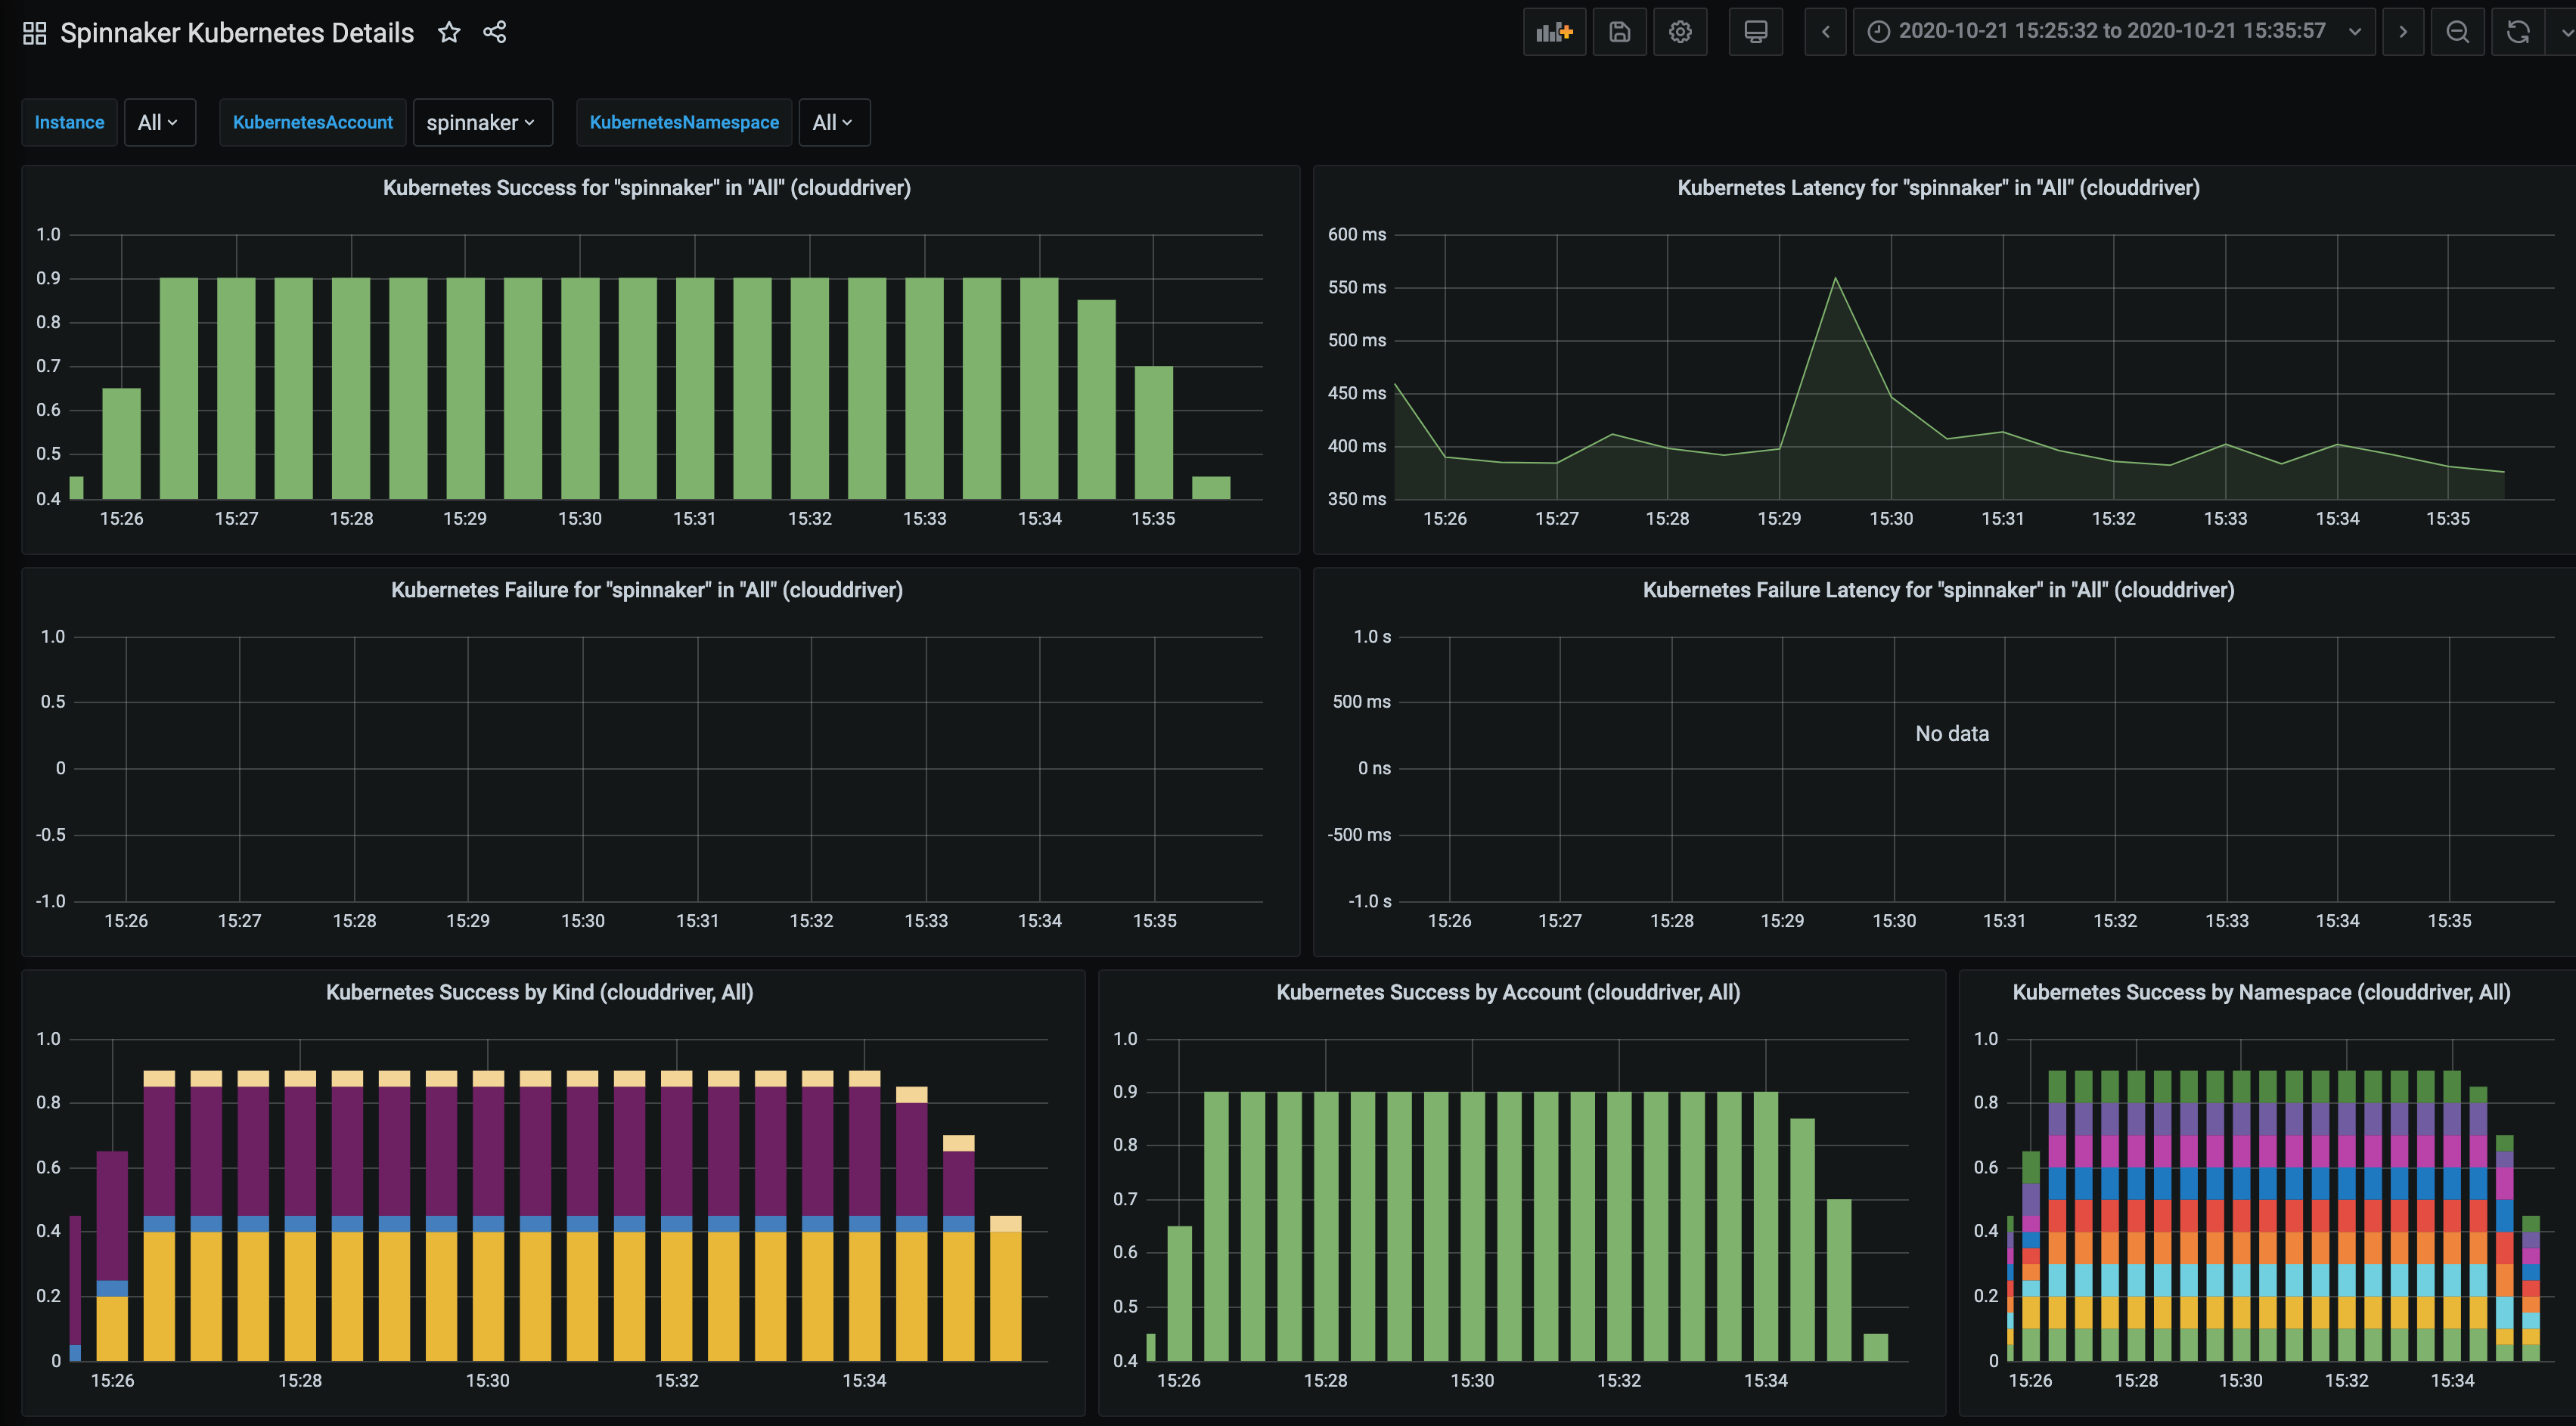
After importing the dashboards, you can explore graphs for each service by clicking on Dashboards > Manage > Spinnaker Kubernetes Details.
Available metrics by service
Disclaimer: the following tables may not contain every available metric for each service.
Clouddriver
| Metric Name | Base Unit | Description |
|---|---|---|
| amazonClientProvider_rateLimitDelayMillis | ||
| authorization | ||
| aws_request_clientExecuteTime | milliseconds | |
| aws_request_credentialsRequestTime | milliseconds | |
| aws_request_httpClientReceiveResponseTime | milliseconds | |
| aws_request_httpClientSendRequestTime | milliseconds | |
| aws_request_httpRequestTime | milliseconds | |
| aws_request_requestCount | ||
| aws_request_requestMarshallTime | milliseconds | |
| aws_request_requestSigningTime | milliseconds | |
| aws_request_responseProcessingTime | milliseconds | |
| aws_request_retryPauseTime | milliseconds | |
| aws_request_throttling | ||
| awsSdkClientSupplier_averageLoadPenalty | ||
| awsSdkClientSupplier_hitCount | ||
| awsSdkClientSupplier_loadExceptionCount | ||
| awsSdkClientSupplier_missRate | ||
| cats_sqlCache_evict_deleteOperations | ||
| cats_sqlCache_evict_itemCount | ||
| cats_sqlCache_evict_itemsDeleted | ||
| cats_sqlCache_get_itemCount | ||
| cats_sqlCache_get_relationshipsRequested | ||
| cats_sqlCache_get_requestedSize | ||
| cats_sqlCache_get_selectOperations | ||
| cats_sqlCache_merge_deleteOperations | ||
| cats_sqlCache_merge_itemCount | ||
| cats_sqlCache_merge_itemsStored | ||
| cats_sqlCache_merge_relationshipCount | ||
| cats_sqlCache_merge_relationshipsStored | ||
| cats_sqlCache_merge_selectOperations | ||
| cats_sqlCache_merge_writeOperations | ||
| cf_okhttp_requests | milliseconds | Timer of OkHttp operation |
| controller_invocations | ||
| controller_invocations_contentLength | ||
| controller_invocations_contentLength_summary | ||
| executionTime | milliseconds | |
| health_kubernetes_errors | ||
| http_server_requests | milliseconds | |
| jvm_buffer_count | buffers | An estimate of the number of buffers in the pool |
| jvm_gc_pause | milliseconds | Time spent in GC pause |
| jvm_memory_committed | bytes | The amount of memory in bytes that is committed for the Java virtual machine to use |
| jvm_memory_max | bytes | The maximum amount of memory in bytes that can be used for memory management |
| jvm_threads_daemon | threads | The current number of live daemon threads |
| jvm_threads_peak | threads | The peak live thread count since the Java virtual machine started or peak was reset |
| jvm_threads_states | threads | The current number of threads having BLOCKED state |
| kubernetes_api | milliseconds | |
| logback_events | events | Number of debug level events that made it to the logs |
| onDemand_cache | milliseconds | |
| onDemand_count | ||
| onDemand_error | ||
| onDemand_evict | milliseconds | |
| onDemand_read | milliseconds | |
| onDemand_store | milliseconds | |
| onDemand_total | milliseconds | |
| onDemand_transform | milliseconds | |
| operations | milliseconds | |
| orchestrations | milliseconds | |
| process_files_max | files | The maximum file descriptor count |
| reservedInstances_surplusByAccountClassic | ||
| reservedInstances_surplusByAccountVpc | ||
| reservedInstances_surplusOverall | ||
| resilience4j_retry_calls | The number of failed calls after a retry attempt | |
| sql_cacheCleanupAgent_dataTypeCleanupDuration | milliseconds | |
| sql_cacheCleanupAgent_dataTypeRecordsDeleted | ||
| sql_healthProvider_invocations | ||
| sql_taskCleanupAgent_deleted | ||
| sql_taskCleanupAgent_timing | milliseconds | |
| system_load_average_1m | The sum of the number of runnable entities queued to available processors and the number of runnable entities running on the available processors averaged over a period of time | |
| tasks | ||
| tasks | ||
| tomcat_sessions_active_current | sessions | |
| tomcat_sessions_expired | sessions | |
| tomcat_sessions_rejected | sessions |
Echo
| Metric Name | Base Unit | Description |
|---|---|---|
| aws_request_httpClientGetConnectionTime | milliseconds | |
| controller_invocations | ||
| controller_invocations_contentLength | ||
| controller_invocations_contentLength_summary | ||
| echo_events_processed | ||
| echo_triggers_sync_executionTimeMillis | milliseconds | |
| fiat_enabled | ||
| fiat_getPermission | ||
| fiat_legacyFallback_enabled | ||
| fiat_permissionsCache_evictions | ||
| fiat_permissionsCache_evictions-weight | ||
| fiat_permissionsCache_hits | ||
| fiat_permissionsCache_loads | milliseconds | |
| fiat_permissionsCache_loads-failure | ||
| fiat_permissionsCache_loads-success | ||
| fiat_permissionsCache_misses | ||
| front50_lastPoll | ||
| front50_requests | ||
| http_server_requests | milliseconds | |
| jvm_buffer_count | buffers | An estimate of the number of buffers in the pool |
| jvm_buffer_memory_used | bytes | An estimate of the memory that the Java virtual machine is using for this buffer pool |
| jvm_buffer_total_capacity | bytes | An estimate of the total capacity of the buffers in this pool |
| jvm_classes_loaded | classes | The number of classes that are currently loaded in the Java virtual machine |
| jvm_classes_unloaded | classes | The total number of classes unloaded since the Java virtual machine has started execution |
| jvm_gc_allocationRate | ||
| jvm_gc_live_data_size | bytes | Size of old generation memory pool after a full GC |
| jvm_gc_liveDataSize | ||
| jvm_gc_max_data_size | bytes | Max size of old generation memory pool |
| jvm_gc_maxDataSize | ||
| jvm_gc_memory_allocated | bytes | Incremented for an increase in the size of the young generation memory pool after one GC to before the next |
| jvm_gc_memory_promoted | bytes | Count of positive increases in the size of the old generation memory pool before GC to after GC |
| jvm_gc_pause | milliseconds | Time spent in GC pause |
| jvm_gc_promotionRate | ||
| jvm_memory_committed | bytes | The amount of memory in bytes that is committed for the Java virtual machine to use |
| jvm_memory_max | bytes | The maximum amount of memory in bytes that can be used for memory management |
| jvm_memory_used | bytes | The amount of used memory |
| jvm_threads_daemon | threads | The current number of live daemon threads |
| jvm_threads_live | threads | The current number of live threads including both daemon and non-daemon threads |
| jvm_threads_peak | threads | The peak live thread count since the Java virtual machine started or peak was reset |
| jvm_threads_states | threads | The current number of threads having NEW state |
| logback_events | events | Number of info level events that made it to the logs |
| okhttp_requests | milliseconds | |
| orca_requests | ||
| orca_trigger_success | ||
| pipelines_triggered | ||
| process_cpu_usage | The recent cpu usage for the Java Virtual Machine process | |
| process_files_max | files | The maximum file descriptor count |
| process_files_open | files | The open file descriptor count |
| process_start_time | milliseconds | Start time of the process since unix epoch_ |
| process_uptime | milliseconds | The uptime of the Java virtual machine |
| quietPeriod_tests | ||
| resilience4j_circuitbreaker_buffered_calls | The number of buffered failed calls stored in the ring buffer | |
| resilience4j_circuitbreaker_calls | milliseconds | Total number of calls which failed but the exception was ignored |
| resilience4j_circuitbreaker_failure_rate | The failure rate of the circuit breaker | |
| resilience4j_circuitbreaker_slow_call_rate | The slow call of the circuit breaker | |
| resilience4j_circuitbreaker_state | The states of the circuit breaker | |
| system_cpu_count | The number of processors available to the Java virtual machine | |
| system_load_average_1m | The sum of the number of runnable entities queued to available processors and the number of runnable entities running on the available processors averaged over a period of time | |
| tomcat_sessions_active_current | sessions | |
| tomcat_sessions_active_max | sessions | |
| tomcat_sessions_alive_max | milliseconds | |
| tomcat_sessions_created | sessions | |
| tomcat_sessions_expired | sessions | |
| tomcat_sessions_rejected | sessions |
Fiat
| Metric Name | Base Unit | Description |
|---|---|---|
| controller_invocations | ||
| controller_invocations_contentLength | ||
| controller_invocations_contentLength_summary | ||
| fiat_getUserPermission | ||
| fiat_userRoles_syncAnonymous | milliseconds | |
| fiat_userRoles_syncCount | ||
| fiat_userRoles_syncTime | milliseconds | |
| fiat_userRoles_syncUsers | milliseconds | |
| http_server_requests | milliseconds | |
| jvm_buffer_count | buffers | An estimate of the number of buffers in the pool |
| jvm_buffer_memory_used | bytes | An estimate of the memory that the Java virtual machine is using for this buffer pool |
| jvm_buffer_total_capacity | bytes | An estimate of the total capacity of the buffers in this pool |
| jvm_classes_loaded | classes | The number of classes that are currently loaded in the Java virtual machine |
| jvm_classes_unloaded | classes | The total number of classes unloaded since the Java virtual machine has started execution |
| jvm_gc_allocationRate | ||
| jvm_gc_live_data_size | bytes | Size of old generation memory pool after a full GC |
| jvm_gc_liveDataSize | ||
| jvm_gc_max_data_size | bytes | Max size of old generation memory pool |
| jvm_gc_maxDataSize | ||
| jvm_gc_memory_allocated | bytes | Incremented for an increase in the size of the young generation memory pool after one GC to before the next |
| jvm_gc_memory_promoted | bytes | Count of positive increases in the size of the old generation memory pool before GC to after GC |
| jvm_gc_pause | milliseconds | Time spent in GC pause |
| jvm_gc_promotionRate | ||
| jvm_memory_committed | bytes | The amount of memory in bytes that is committed for the Java virtual machine to use |
| jvm_memory_max | bytes | The maximum amount of memory in bytes that can be used for memory management |
| jvm_memory_used | bytes | The amount of used memory |
| jvm_threads_daemon | threads | The current number of live daemon threads |
| jvm_threads_live | threads | The current number of live threads including both daemon and non-daemon threads |
| jvm_threads_peak | threads | The peak live thread count since the Java virtual machine started or peak was reset |
| jvm_threads_states | threads | The current number of threads having TERMINATED state |
| kork_lock_acquire | ||
| kork_lock_acquire_duration | ||
| kork_lock_heartbeat | ||
| kork_lock_release | ||
| logback_events | events | Number of debug level events that made it to the logs |
| okhttp_requests | milliseconds | |
| permissionsRepository_get1_invocations | ||
| permissionsRepository_get1_timing | ||
| permissionsRepository_getAllById_invocations | ||
| permissionsRepository_getAllById_timing | ||
| permissionsRepository_put1_invocations | ||
| permissionsRepository_put1_timing | ||
| permissionsRepository_putAllById1_invocations | ||
| permissionsRepository_putAllById1_timing | ||
| process_cpu_usage | The recent cpu usage for the Java Virtual Machine process | |
| process_files_max | files | The maximum file descriptor count |
| process_files_open | files | The open file descriptor count |
| process_start_time | milliseconds | Start time of the process since unix epoch_ |
| process_uptime | milliseconds | The uptime of the Java virtual machine |
| redis_command_invocation_del | ||
| redis_command_invocation_eval | ||
| redis_command_invocation_get | ||
| redis_command_invocation_hgetAll | ||
| redis_command_invocation_hmset | ||
| redis_command_invocation_hscan | ||
| redis_command_invocation_pipelined | ||
| redis_command_invocation_rename | ||
| redis_command_invocation_sadd | ||
| redis_command_invocation_set | ||
| redis_command_invocation_sismember | ||
| redis_command_invocation_srem | ||
| redis_command_invocation_sscan | ||
| redis_command_invocation_time | ||
| redis_command_latency_del | ||
| redis_command_latency_eval | milliseconds | |
| redis_command_latency_get | milliseconds | |
| redis_command_latency_get | ||
| redis_command_latency_hgetAll | ||
| redis_command_latency_hmset | ||
| redis_command_latency_hscan | ||
| redis_command_latency_pipelined | ||
| redis_command_latency_rename | ||
| redis_command_latency_sadd | ||
| redis_command_latency_set | ||
| redis_command_latency_sismember | ||
| redis_command_latency_srem | ||
| redis_command_latency_sscan | ||
| redis_command_latency_time | ||
| redis_command_payloadSize_eval | ||
| redis_command_payloadSize_eval_summary | ||
| redis_command_payloadSize_sadd | ||
| redis_command_payloadSize_sadd_summary | ||
| redis_command_payloadSize_set | ||
| redis_command_payloadSize_set_summary | ||
| resilience4j_circuitbreaker_buffered_calls | The number of buffered failed calls stored in the ring buffer | |
| resilience4j_circuitbreaker_calls | milliseconds | |
| resilience4j_circuitbreaker_failure_rate | The failure rate of the circuit breaker | |
| resilience4j_circuitbreaker_slow_call_rate | The slow call of the circuit breaker | |
| resilience4j_circuitbreaker_state | The states of the circuit breaker | |
| resilience4j_retry_calls | The number of failed calls after a retry attempt | |
| system_cpu_count | The number of processors available to the Java virtual machine | |
| system_cpu_usage | The recent cpu usage for the whole system | |
| system_load_average_1m | The sum of the number of runnable entities queued to available processors and the number of runnable entities running on the available processors averaged over a period of time | |
| tomcat_sessions_active_current | sessions | |
| tomcat_sessions_active_max | sessions | |
| tomcat_sessions_alive_max | milliseconds | |
| tomcat_sessions_created | sessions | |
| tomcat_sessions_expired | sessions | |
| tomcat_sessions_rejected | sessions |
Front50
| Metric Name | Base Unit | Description |
|---|---|---|
| aws_request_clientExecuteTime | milliseconds | |
| aws_request_credentialsRequestTime | milliseconds | |
| aws_request_httpClientGetConnectionTime | milliseconds | |
| aws_request_httpClientReceiveResponseTime | milliseconds | |
| aws_request_httpClientSendRequestTime | milliseconds | |
| aws_request_httpRequestTime | milliseconds | |
| aws_request_requestCount | ||
| aws_request_requestSigningTime | milliseconds | |
| aws_request_responseProcessingTime | milliseconds | |
| aws_request_retryPauseTime | milliseconds | |
| controller_invocations | ||
| controller_invocations_contentLength | ||
| controller_invocations_contentLength_summary | ||
| fiat_enabled | ||
| fiat_getPermission | ||
| fiat_legacyFallback_enabled | ||
| fiat_permissionsCache_evictions | ||
| fiat_permissionsCache_evictions-weight | ||
| fiat_permissionsCache_hits | ||
| fiat_permissionsCache_loads | milliseconds | |
| fiat_permissionsCache_loads-failure | ||
| fiat_permissionsCache_loads-success | ||
| fiat_permissionsCache_misses | ||
| http_server_requests | milliseconds | |
| jvm_buffer_count | buffers | An estimate of the number of buffers in the pool |
| jvm_buffer_memory_used | bytes | An estimate of the memory that the Java virtual machine is using for this buffer pool |
| jvm_buffer_total_capacity | bytes | An estimate of the total capacity of the buffers in this pool |
| jvm_classes_loaded | classes | The number of classes that are currently loaded in the Java virtual machine |
| jvm_classes_unloaded | classes | The total number of classes unloaded since the Java virtual machine has started execution |
| jvm_gc_allocationRate | ||
| jvm_gc_live_data_size | bytes | Size of old generation memory pool after a full GC |
| jvm_gc_liveDataSize | ||
| jvm_gc_max_data_size | bytes | Max size of old generation memory pool |
| jvm_gc_maxDataSize | ||
| jvm_gc_memory_allocated | bytes | Incremented for an increase in the size of the young generation memory pool after one GC to before the next |
| jvm_gc_memory_promoted | bytes | Count of positive increases in the size of the old generation memory pool before GC to after GC |
| jvm_gc_pause | milliseconds | Time spent in GC pause |
| jvm_gc_promotionRate | ||
| jvm_memory_committed | bytes | The amount of memory in bytes that is committed for the Java virtual machine to use |
| jvm_memory_max | bytes | The maximum amount of memory in bytes that can be used for memory management |
| jvm_memory_used | bytes | The amount of used memory |
| jvm_threads_daemon | threads | The current number of live daemon threads |
| jvm_threads_live | threads | The current number of live threads including both daemon and non-daemon threads |
| jvm_threads_peak | threads | The peak live thread count since the Java virtual machine started or peak was reset |
| jvm_threads_states | threads | The current number of threads having WAITING state |
| logback_events | events | Number of error level events that made it to the logs |
| okhttp_requests | milliseconds | |
| process_cpu_usage | The recent cpu usage for the Java Virtual Machine process | |
| process_files_max | files | The maximum file descriptor count |
| process_files_open | files | The open file descriptor count |
| process_start_time | milliseconds | Start time of the process since unix epoch_ |
| process_uptime | milliseconds | The uptime of the Java virtual machine |
| resilience4j_circuitbreaker_buffered_calls | ||
| resilience4j_circuitbreaker_calls | milliseconds | |
| resilience4j_circuitbreaker_failure_rate | The failure rate of the circuit breaker | |
| resilience4j_circuitbreaker_slow_call_rate | The slow call of the circuit breaker | |
| resilience4j_circuitbreaker_slow_calls | The number of slow failed calls which were slower than a certain threshold | |
| resilience4j_circuitbreaker_state | The states of the circuit breaker | |
| storageServiceSupport_autoRefreshTime | milliseconds | |
| storageServiceSupport_cacheAge | ||
| storageServiceSupport_cacheRefreshTime | milliseconds | |
| storageServiceSupport_cacheSize | ||
| storageServiceSupport_mismatchedIds | ||
| storageServiceSupport_numAdded | ||
| storageServiceSupport_numRemoved | ||
| storageServiceSupport_numUpdated | ||
| storageServiceSupport_scheduledRefreshTime | milliseconds | |
| system_cpu_count | The number of processors available to the Java virtual machine | |
| system_cpu_usage | The recent cpu usage for the whole system | |
| system_load_average_1m | The sum of the number of runnable entities queued to available processors and the number of runnable entities running on the available processors averaged over a period of time | |
| tomcat_sessions_active_current | sessions | |
| tomcat_sessions_active_max | sessions | |
| tomcat_sessions_alive_max | milliseconds | |
| tomcat_sessions_created | sessions | |
| tomcat_sessions_expired | sessions | |
| tomcat_sessions_rejected | sessions |
Gate
| Metric Name | Base Unit | Description |
|---|---|---|
| controller_invocations | ||
| controller_invocations_contentLength | ||
| controller_invocations_contentLength_summary | ||
| fiat_enabled | ||
| fiat_getPermission | ||
| fiat_legacyFallback_enabled | ||
| fiat_login | ||
| fiat_permissionsCache_evictions | ||
| fiat_permissionsCache_evictions-weight | ||
| fiat_permissionsCache_hits | ||
| fiat_permissionsCache_loads | milliseconds | |
| fiat_permissionsCache_loads-failure | ||
| fiat_permissionsCache_loads-success | ||
| fiat_permissionsCache_misses | ||
| http_server_requests | milliseconds | |
| http_server_requests | milliseconds | |
| http_server_requests | milliseconds | |
| jvm_buffer_count | buffers | An estimate of the number of buffers in the pool |
| jvm_buffer_memory_used | bytes | An estimate of the memory that the Java virtual machine is using for this buffer pool |
| jvm_buffer_total_capacity | bytes | An estimate of the total capacity of the buffers in this pool |
| jvm_classes_loaded | classes | The number of classes that are currently loaded in the Java virtual machine |
| jvm_classes_unloaded | classes | The total number of classes unloaded since the Java virtual machine has started execution |
| jvm_gc_allocationRate | ||
| jvm_gc_live_data_size | bytes | Size of old generation memory pool after a full GC |
| jvm_gc_liveDataSize | ||
| jvm_gc_max_data_size | bytes | Max size of old generation memory pool |
| jvm_gc_maxDataSize | ||
| jvm_gc_memory_allocated | bytes | Incremented for an increase in the size of the young generation memory pool after one GC to before the next |
| jvm_gc_memory_promoted | bytes | Count of positive increases in the size of the old generation memory pool before GC to after GC |
| jvm_gc_pause | milliseconds | Time spent in GC pause |
| jvm_gc_promotionRate | ||
| jvm_memory_committed | bytes | The amount of memory in bytes that is committed for the Java virtual machine to use |
| jvm_memory_max | bytes | The maximum amount of memory in bytes that can be used for memory management |
| jvm_memory_used | bytes | The amount of used memory |
| jvm_threads_daemon | threads | The current number of live daemon threads |
| jvm_threads_live | threads | The current number of live threads including both daemon and non-daemon threads |
| jvm_threads_peak | threads | The peak live thread count since the Java virtual machine started or peak was reset |
| jvm_threads_peak | threads | The peak live thread count since the Java virtual machine started or peak was reset |
| jvm_threads_states | threads | The current number of threads having RUNNABLE state |
| logback_events | events | Number of error level events that made it to the logs |
| okhttp_requests | milliseconds | |
| plugins_deckAssets_hits | ||
| plugins_deckCache_downloadDuration | milliseconds | |
| plugins_deckCache_hits | ||
| plugins_deckCache_misses | ||
| plugins_deckCache_refreshDuration | milliseconds | |
| plugins_deckCache_versions | ||
| process_cpu_usage | The recent cpu usage for the Java Virtual Machine process | |
| process_files_max | files | The maximum file descriptor count |
| process_files_open | files | The open file descriptor count |
| process_start_time | milliseconds | Start time of the process since unix epoch_ |
| process_uptime | milliseconds | The uptime of the Java virtual machine |
| system_cpu_count | The number of processors available to the Java virtual machine | |
| system_cpu_usage | The recent cpu usage for the whole system | |
| system_load_average_1m | The sum of the number of runnable entities queued to available processors and the number of runnable entities running on the available processors averaged over a period of time | |
| tomcat_sessions_active_current | sessions | |
| tomcat_sessions_active_current | sessions | |
| tomcat_sessions_active_max | sessions | |
| tomcat_sessions_alive_max | milliseconds | |
| tomcat_sessions_created | sessions | |
| tomcat_sessions_expired | sessions | |
| tomcat_sessions_rejected | sessions |
Igor
| Metric Name | Base Unit | Description |
|---|---|---|
| controller_invocations | ||
| controller_invocations_contentLength | ||
| controller_invocations_contentLength_summary | ||
| fiat_enabled | ||
| fiat_getPermission | ||
| fiat_legacyFallback_enabled | ||
| fiat_permissionsCache_evictions | ||
| fiat_permissionsCache_evictions-weight | ||
| fiat_permissionsCache_hits | ||
| fiat_permissionsCache_loads | milliseconds | |
| fiat_permissionsCache_loads-failure | ||
| fiat_permissionsCache_loads-success | ||
| fiat_permissionsCache_misses | ||
| http_server_requests | milliseconds | |
| jvm_buffer_count | buffers | An estimate of the number of buffers in the pool |
| jvm_buffer_memory_used | bytes | An estimate of the memory that the Java virtual machine is using for this buffer pool |
| jvm_classes_loaded | classes | The number of classes that are currently loaded in the Java virtual machine |
| jvm_classes_unloaded | classes | The total number of classes unloaded since the Java virtual machine has started execution |
| jvm_gc_allocationRate | ||
| jvm_gc_live_data_size | bytes | Size of old generation memory pool after a full GC |
| jvm_gc_liveDataSize | ||
| jvm_gc_max_data_size | bytes | Max size of old generation memory pool |
| jvm_gc_maxDataSize | ||
| jvm_gc_memory_allocated | bytes | Incremented for an increase in the size of the young generation memory pool after one GC to before the next |
| jvm_gc_pause | milliseconds | Time spent in GC pause |
| jvm_gc_promotionRate | ||
| jvm_memory_committed | bytes | The amount of memory in bytes that is committed for the Java virtual machine to use |
| jvm_memory_max | bytes | The maximum amount of memory in bytes that can be used for memory management |
| jvm_memory_used | bytes | The amount of used memory |
| jvm_threads_daemon | threads | The current number of live daemon threads |
| jvm_threads_live | threads | The current number of live threads including both daemon and non-daemon threads |
| jvm_threads_peak | threads | The peak live thread count since the Java virtual machine started or peak was reset |
| jvm_threads_states | threads | The current number of threads having NEW state |
| logback_events | events | |
| okhttp_requests | milliseconds | |
| pollingMonitor_docker_retrieveImagesByAccount | milliseconds | |
| pollingMonitor_jenkins_retrieveProjects | milliseconds | |
| pollingMonitor_pollTiming | milliseconds | |
| process_cpu_usage | The recent cpu usage for the Java Virtual Machine process | |
| process_files_max | files | The maximum file descriptor count |
| process_files_open | files | The open file descriptor count |
| process_start_time | milliseconds | Start time of the process since unix epoch_ |
| process_uptime | milliseconds | The uptime of the Java virtual machine |
| resilience4j_circuitbreaker_buffered_calls | The number of buffered failed calls stored in the ring buffer | |
| resilience4j_circuitbreaker_calls | Total number of not permitted calls | |
| resilience4j_circuitbreaker_failure_rate | The failure rate of the circuit breaker | |
| resilience4j_circuitbreaker_slow_call_rate | The slow call of the circuit breaker | |
| resilience4j_circuitbreaker_state | The states of the circuit breaker | |
| system_cpu_count | The number of processors available to the Java virtual machine | |
| system_cpu_usage | The recent cpu usage for the whole system | |
| system_load_average_1m | The sum of the number of runnable entities queued to available processors and the number of runnable entities running on the available processors averaged over a period of time | |
| tomcat_sessions_active_current | sessions | |
| tomcat_sessions_alive_max | milliseconds | |
| tomcat_sessions_created | sessions | |
| tomcat_sessions_expired | sessions | |
| tomcat_sessions_rejected | sessions |
Kayenta
| Metric Name | Base Unit | Description |
|---|---|---|
| canary_pipelines_initiated | ||
| canary_telemetry_query | ||
| controller_invocations | milliseconds | |
| controller_invocations_contentLength | ||
| controller_invocations_contentLength_summary | ||
| executions_active | ||
| executions_completed | ||
| executions_started | ||
| http_server_requests | milliseconds | |
| jvm_gc_allocationRate | ||
| jvm_gc_liveDataSize | ||
| jvm_gc_maxDataSize | ||
| jvm_gc_pause | milliseconds | |
| jvm_gc_promotionRate | ||
| okhttp_requests | milliseconds | |
| orca_task_result | ||
| queue_acknowledged_messages | ||
| queue_depth | ||
| queue_duplicate_messages | ||
| queue_last_poll_age | ||
| queue_last_retry_check_age | ||
| queue_message_lag | milliseconds | |
| queue_orphaned_messages | ||
| queue_pushed_messages | ||
| queue_ready_depth | ||
| queue_unacked_depth | ||
| redis_command_invocation_exists | ||
| redis_command_invocation_hdel | ||
| redis_command_invocation_hget | ||
| redis_command_invocation_hgetAll | ||
| redis_command_invocation_hmset | ||
| redis_command_invocation_hset | ||
| redis_command_invocation_multi | ||
| redis_command_invocation_sadd | ||
| redis_command_invocation_srem | ||
| redis_command_invocation_zadd | ||
| redis_command_latency_exists | ||
| redis_command_latency_exists | ||
| redis_command_latency_hdel | ||
| redis_command_latency_hget | ||
| redis_command_latency_hgetAll | ||
| redis_command_latency_hmset | milliseconds | |
| redis_command_latency_hset | ||
| redis_command_latency_multi | ||
| redis_command_latency_sadd | ||
| redis_command_latency_srem | ||
| redis_command_latency_zadd | ||
| redis_command_payloadSize_hmset | ||
| redis_command_payloadSize_hmset_summary | ||
| redis_command_payloadSize_hset | ||
| redis_command_payloadSize_hset_summary | ||
| redis_command_payloadSize_sadd | ||
| redis_command_payloadSize_sadd_summary | ||
| redis_command_payloadSize_srem | ||
| redis_command_payloadSize_srem_summary | ||
| redis_connectionPool_maxIdle | ||
| redis_connectionPool_minIdle | ||
| redis_connectionPool_numActive | ||
| redis_connectionPool_numIdle | ||
| redis_connectionPool_numWaiters | ||
| redis_executionRepository_store1_invocations | ||
| redis_executionRepository_store1_timing | milliseconds | |
| redis_executionRepository_storeStage1_invocations | ||
| redis_executionRepository_storeStage1_timing | ||
| redis_executionRepository_updateStatus1_invocations | ||
| redis_executionRepository_updateStatus1_timing | milliseconds | |
| retrieveById_redis_executionRepository_invocations | ||
| retrieveById_redis_executionRepository_timing | ||
| stage_invocations | ||
| stage_invocations_duration | ||
| task_completions_duration | milliseconds | |
| task_completions_duration_withType | milliseconds | |
| task_invocations_duration | milliseconds | |
| task_invocations_duration_withType | milliseconds | |
| threadpool_activeCount | ||
| threadpool_blockingQueueSize | ||
| threadpool_corePoolSize | ||
| threadpool_maximumPoolSize | ||
| threadpool_poolSize | ||
| tomcat_sessions_active_current | sessions | |
| tomcat_sessions_active_max | sessions | |
| tomcat_sessions_alive_max | milliseconds | |
| tomcat_sessions_created | sessions | |
| tomcat_sessions_expired | sessions | |
| tomcat_sessions_rejected | sessions |
Orca
| Metric Name | Base Unit | Description |
|---|---|---|
| aws_request_httpClientGetConnectionTime | milliseconds | |
| controller_invocations | ||
| controller_invocations_contentLength | ||
| controller_invocations_contentLength_summary | ||
| executions_active | ||
| executions_completed | ||
| executions_started | ||
| executions_totalTime | milliseconds | |
| fiat_enabled | ||
| fiat_getPermission | ||
| fiat_legacyFallback_enabled | ||
| fiat_permissionsCache_loads | milliseconds | |
| fiat_permissionsCache_loads-failure | ||
| http_server_requests | milliseconds | |
| jdbc_connections_active | ||
| jdbc_connections_idle | ||
| jdbc_connections_max | ||
| jvm_gc_allocationRate | ||
| jvm_gc_pause | milliseconds | |
| jvm_gc_promotionRate | ||
| mpt_requests | ||
| okhttp_requests | milliseconds | |
| orca_task_result | ||
| queue_acknowledged_messages | ||
| queue_depth | ||
| queue_duplicate_messages | ||
| queue_last_poll_age | ||
| queue_message_notfound | ||
| queue_orphaned_messages | ||
| queue_pushed_messages | ||
| queue_retried_messages | ||
| queue_unacked_depth | ||
| redis_connectionPool_maxIdle | ||
| redis_connectionPool_numActive | ||
| redis_connectionPool_numIdle | ||
| resilience4j_retry_calls | The number of successful calls after a retry attempt | |
| retrieveById_sql_executions_invocations | ||
| retrieveById_sql_executions_timing | ||
| sql_executions_addStage1_timing | ||
| sql_executions_cancel4_invocations | ||
| sql_executions_cancel4_timing | ||
| sql_executions_countActiveExecutions_invocations | ||
| sql_executions_countActiveExecutions_timing | ||
| sql_executions_handlesPartition1_invocations | ||
| sql_executions_handlesPartition1_timing | milliseconds | |
| sql_executions_retrieveByCorrelationId2_timing | ||
| sql_executions_retrieveOrchestrationsForApplication3_timing | ||
| sql_executions_store1_timing | ||
| sql_executions_storeStage1_invocations | ||
| sql_executions_storeStage1_timing | ||
| sql_executions_updateStatus1_invocations | ||
| sql_executions_updateStatus1_timing | ||
| sql_healthProvider_invocations | ||
| sql_pool_default_connectionAcquiredTiming | milliseconds | |
| sql_queueActivator_invocations | ||
| stage_invocations | ||
| stage_invocations_duration | ||
| task_completions_duration | milliseconds | |
| task_completions_duration_withType | milliseconds | |
| task_invocations_duration | milliseconds | |
| task_invocations_duration_withType | milliseconds | |
| tasks_serverGroupCacheForceRefresh | ||
| threadpool_activeCount | ||
| threadpool_blockingQueueSize | ||
| threadpool_corePoolSize | ||
| threadpool_corePoolSize | ||
| threadpool_maximumPoolSize | ||
| threadpool_poolSize | ||
| tomcat_sessions_active_current | sessions | |
| tomcat_sessions_active_max | sessions | |
| tomcat_sessions_alive_max | milliseconds | |
| tomcat_sessions_rejected | sessions |
Rosco
| Metric Name | Base Unit | Description |
|---|---|---|
| bakesActive | ||
| bakesCompleted | milliseconds | |
| controller_invocations | ||
| controller_invocations_contentLength | ||
| controller_invocations_contentLength_summary | ||
| http_server_requests | milliseconds | |
| jvm_buffer_count | buffers | An estimate of the number of buffers in the pool |
| jvm_buffer_memory_used | bytes | An estimate of the memory that the Java virtual machine is using for this buffer pool |
| jvm_buffer_total_capacity | bytes | An estimate of the total capacity of the buffers in this pool |
| jvm_classes_loaded | classes | The number of classes that are currently loaded in the Java virtual machine |
| jvm_classes_unloaded | classes | The total number of classes unloaded since the Java virtual machine has started execution |
| jvm_gc_allocationRate | ||
| jvm_gc_live_data_size | bytes | Size of old generation memory pool after a full GC |
| jvm_gc_liveDataSize | ||
| jvm_gc_max_data_size | bytes | Max size of old generation memory pool |
| jvm_gc_maxDataSize | ||
| jvm_gc_memory_allocated | bytes | Incremented for an increase in the size of the young generation memory pool after one GC to before the next |
| jvm_gc_memory_promoted | bytes | Count of positive increases in the size of the old generation memory pool before GC to after GC |
| jvm_gc_pause | milliseconds | Time spent in GC pause |
| jvm_gc_promotionRate | ||
| jvm_memory_committed | bytes | The amount of memory in bytes that is committed for the Java virtual machine to use |
| jvm_memory_max | bytes | The maximum amount of memory in bytes that can be used for memory management |
| jvm_memory_used | bytes | The amount of used memory |
| jvm_threads_daemon | threads | The current number of live daemon threads |
| jvm_threads_live | threads | The current number of live threads including both daemon and non-daemon threads |
| jvm_threads_peak | threads | The peak live thread count since the Java virtual machine started or peak was reset |
| jvm_threads_states | threads | |
| logback_events | events | |
| okhttp_requests | milliseconds | |
| process_cpu_usage | The recent cpu usage for the Java Virtual Machine process | |
| process_files_max | files | The maximum file descriptor count |
| process_files_open | files | The open file descriptor count |
| process_start_time | milliseconds | Start time of the process since unix epoch_ |
| process_uptime | milliseconds | The uptime of the Java virtual machine |
| system_cpu_count | The number of processors available to the Java virtual machine | |
| system_cpu_usage | The recent cpu usage for the whole system | |
| system_load_average_1m | The sum of the number of runnable entities queued to available processors and the number of runnable entities running on the available processors averaged over a period of time | |
| tomcat_sessions_active_current | sessions | |
| tomcat_sessions_active_max | sessions | |
| tomcat_sessions_alive_max | milliseconds | |
| tomcat_sessions_created | sessions | |
| tomcat_sessions_expired | sessions | |
| tomcat_sessions_rejected | sessions |
Feedback
Was this page helpful?
Thank you for letting us know!
Sorry to hear that. Please tell us how we can improve.
Last modified October 17, 2023: (aa87b671)