Spinnaker Pipelines
Overview of Spinnaker pipelines
Pipelines are a combination of stages that enable very sophisticated coordination and branching. They are the key to orchestrating deploys in Spinnaker and each one is specific to an application. To see an application’s pipelines, select ‘Applications’ from Spinnaker’s top navigation bar, click on an application’s name, and then press the ‘Pipelines’ tab. The result from a pipeline running is called an execution.
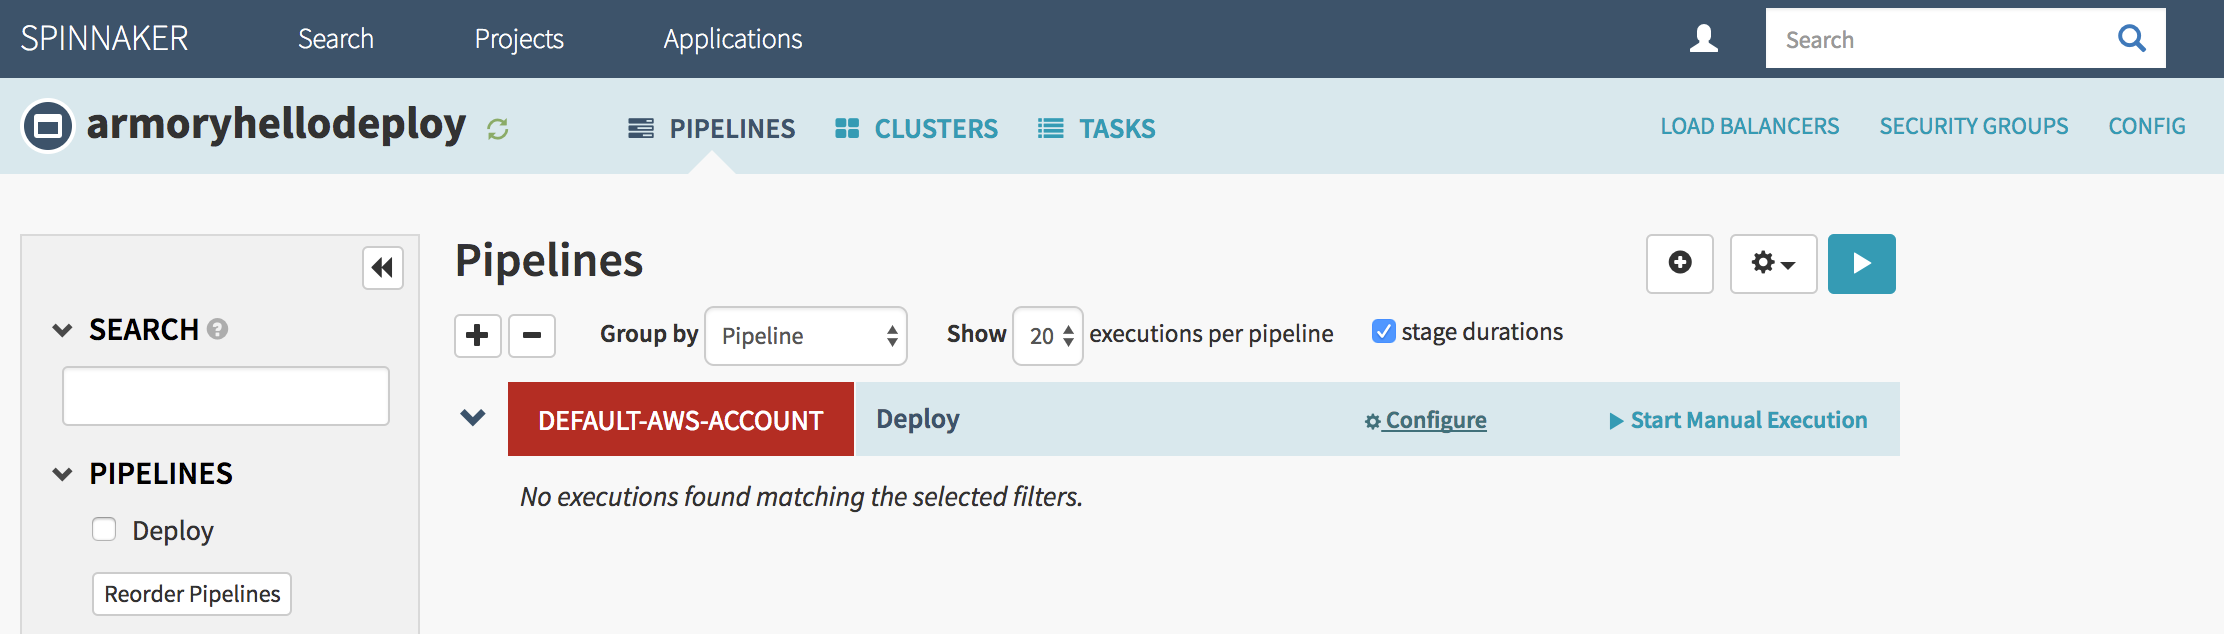
Take this screenshot for example:
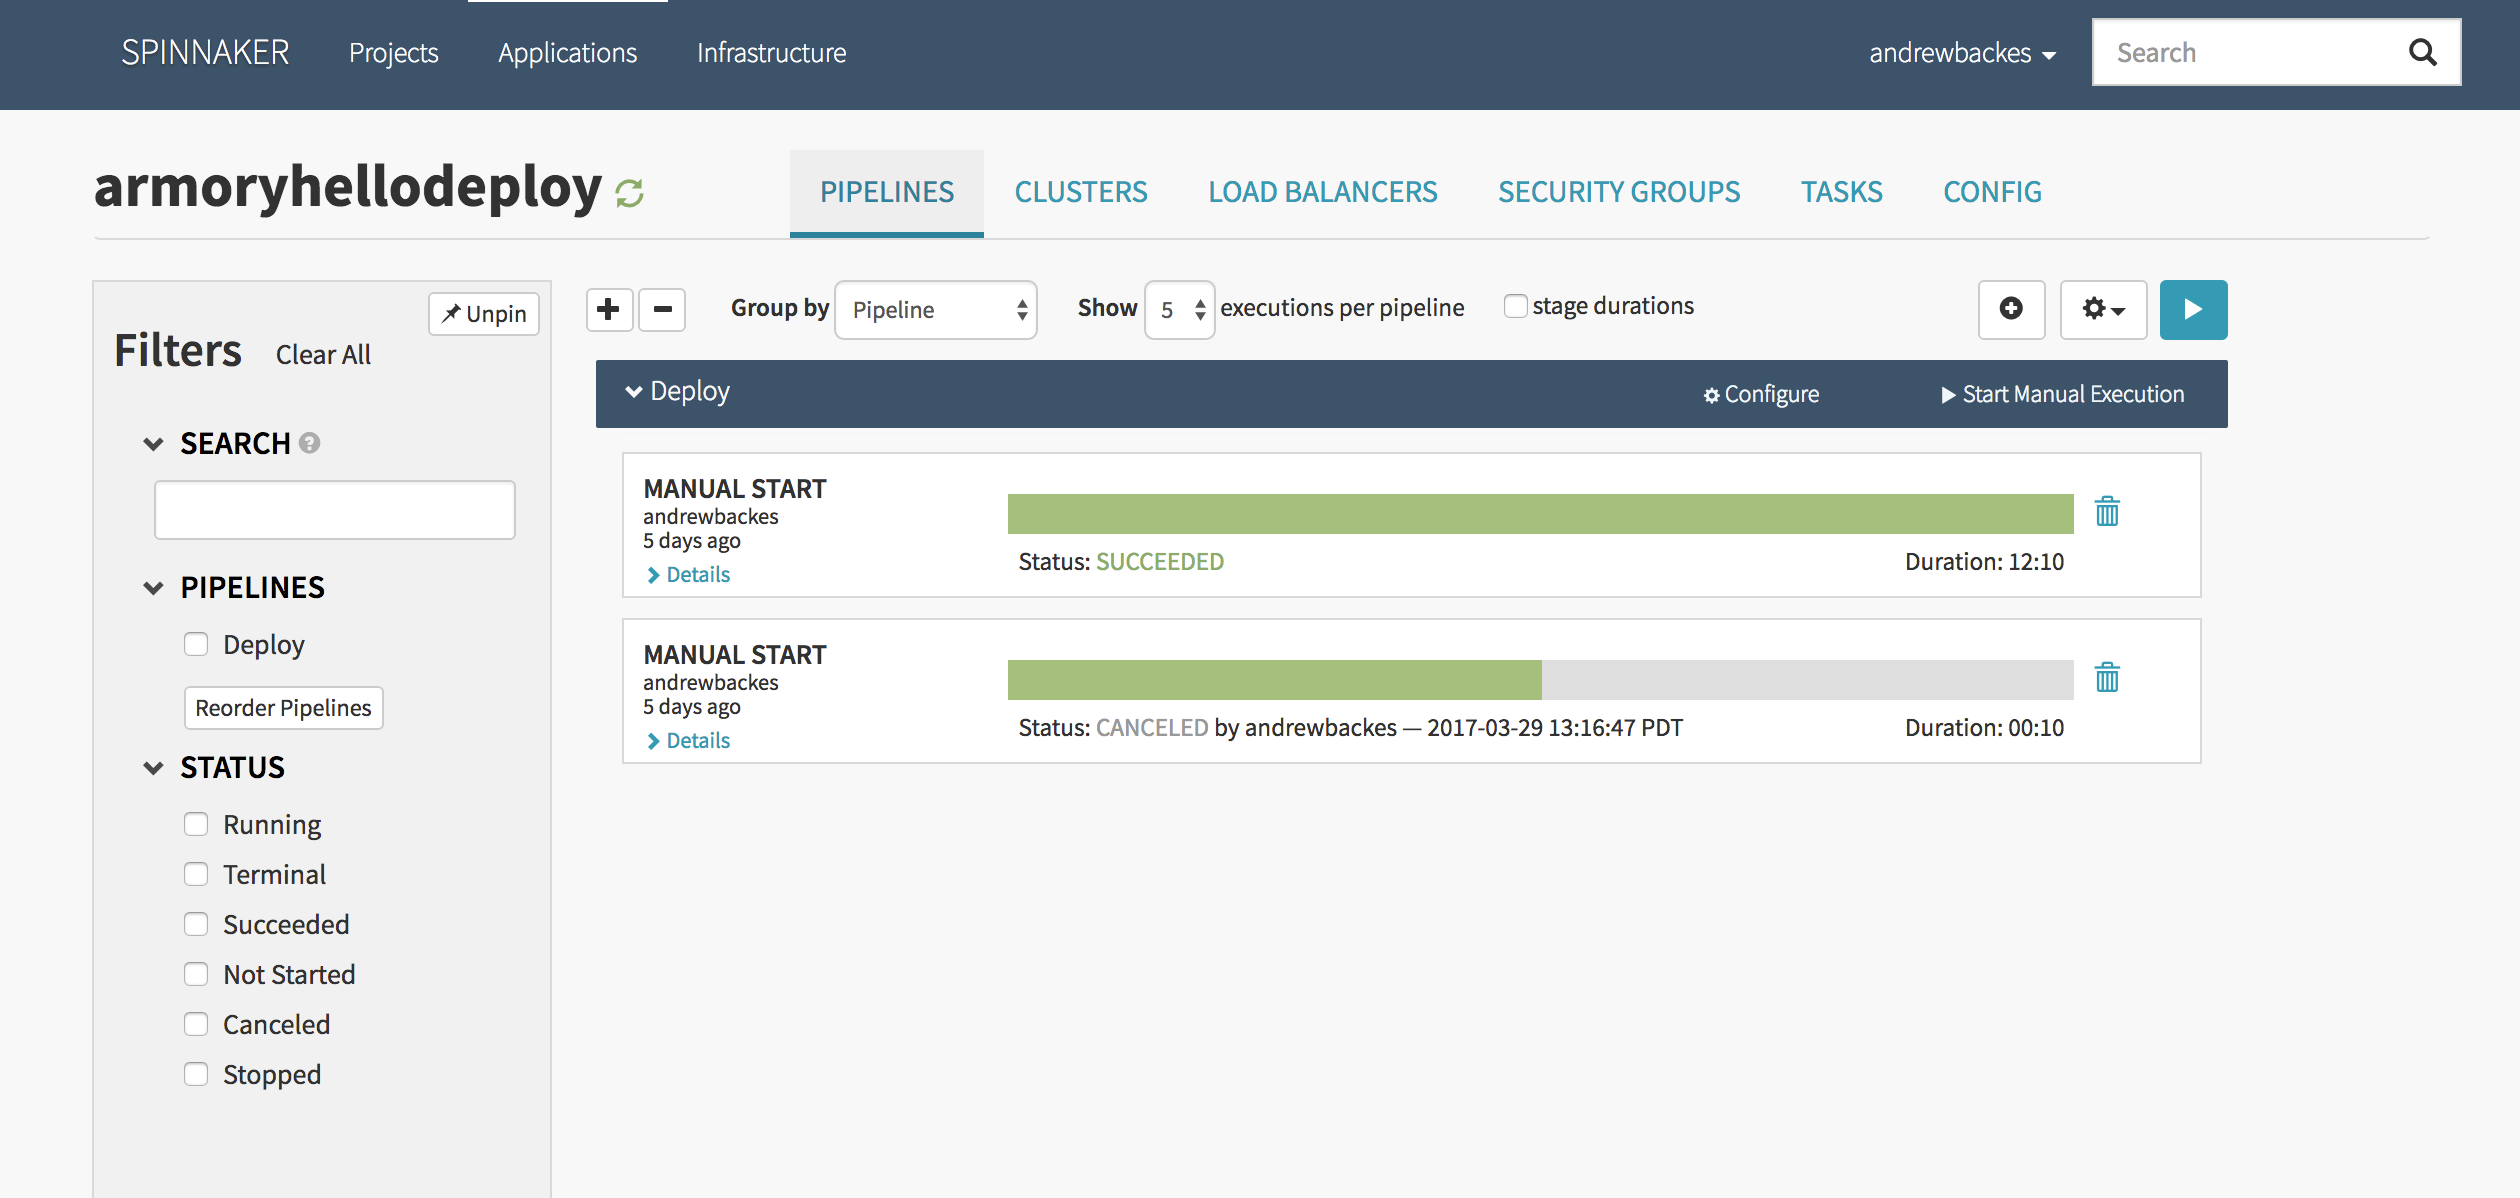
There is a pipeline called ‘Deploy’ with two executions, both labeled ‘Manual Start’. The top execution is marked as ‘Succeeded’ while the bottom is marked as ‘Cancelled’.
For more information on creating bake and deploy pipelines on AWS, checkout the baking and deploying guides.
Manual execution
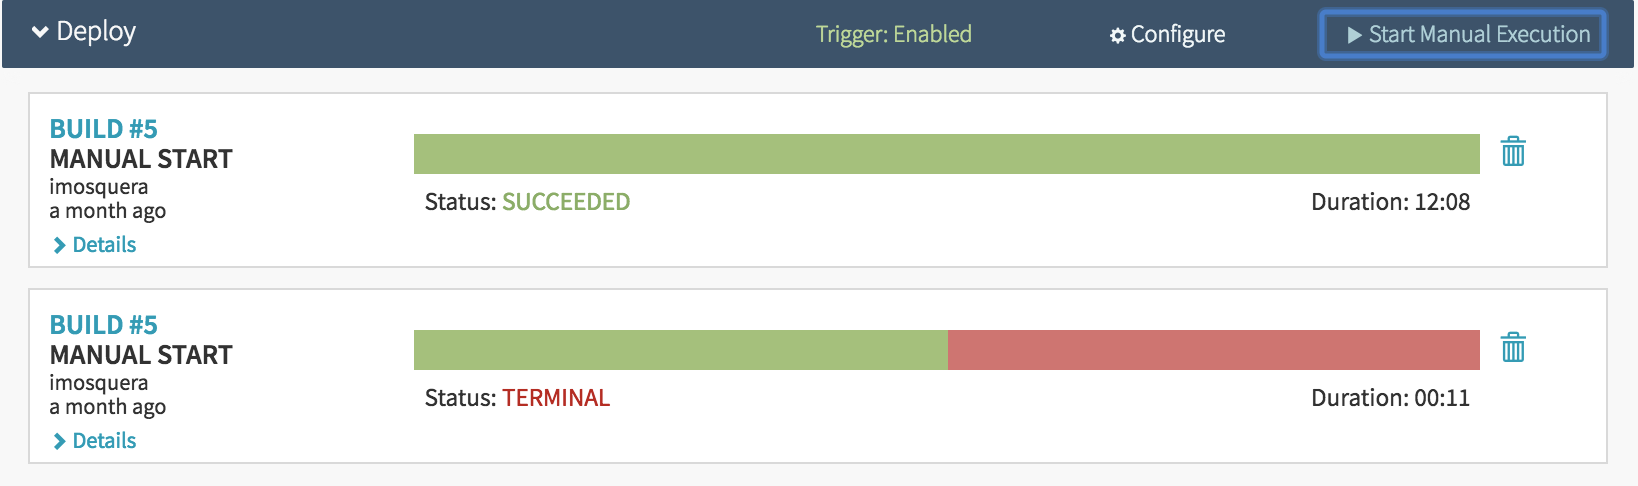
You can re-run an execution by pressing the ‘Start Manual Execution’.
If your pipeline has a Jenkins’ trigger, you can select which Jenkins’ build number to use for running the pipeline.
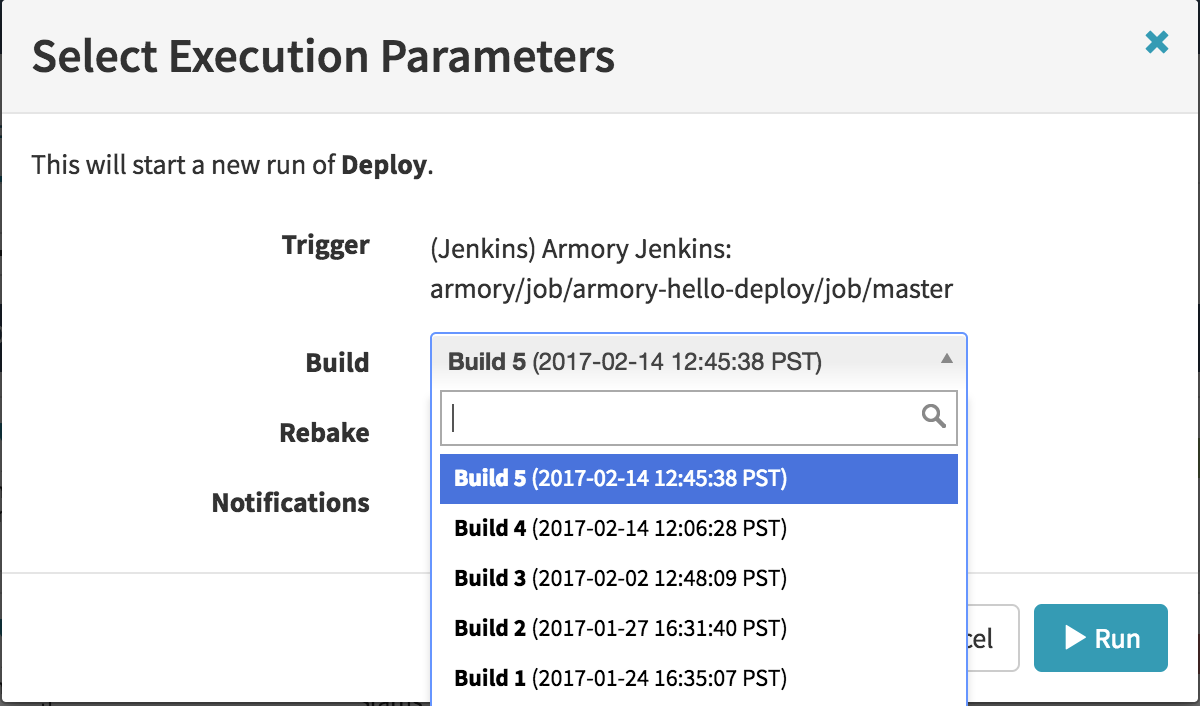
The artifacts produced by the build you select will be used in the pipeline. If your pipeline bakes an image, a cached image will be used if available. To force a rebuild, make sure you specify such before pressing the ‘Run’ button.
Enabling notifications
Spinnaker supports several methods of notification. Notifications can be made when a pipeline runs, succeeds, or fails. You can be contacted via SMS, email, slack, hipchat, and/or pagerduty. Each of these outlets need to be configured within Spinnaker by your Spinnaker Administrator. Once it is configured, you can enable it in your pipeline.
To enable it, navigate to the configuration screen for your pipeline. Make sure you have the ‘Configuration’ stage selected. Scroll down to the ‘Notifications’ section.
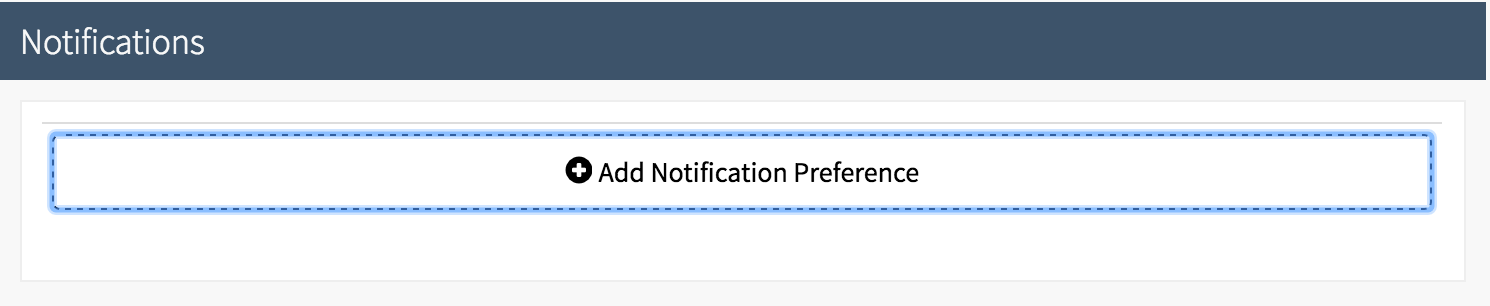
Press ‘Add Notifications Preference’. For example’s sake, I have selected to receive a notification via Slack in the #engineering channel whenever my pipeline fails.
Finally press ‘Update’ to finish. Don’t forget to press ‘Save Changes’ on your pipeline configuration.
Pipeline JSON
Pipelines are represented as JSON behind the scenes. The JSON is interpreted and displayed to you in the UI. However, sometimes it is helpful to view or edit the JSON directly. To access the JSON:
- Click ‘Configure’ on your pipeline:
- Press the ‘Pipeline Actions’ button in the upper right to display a dropdown menu.
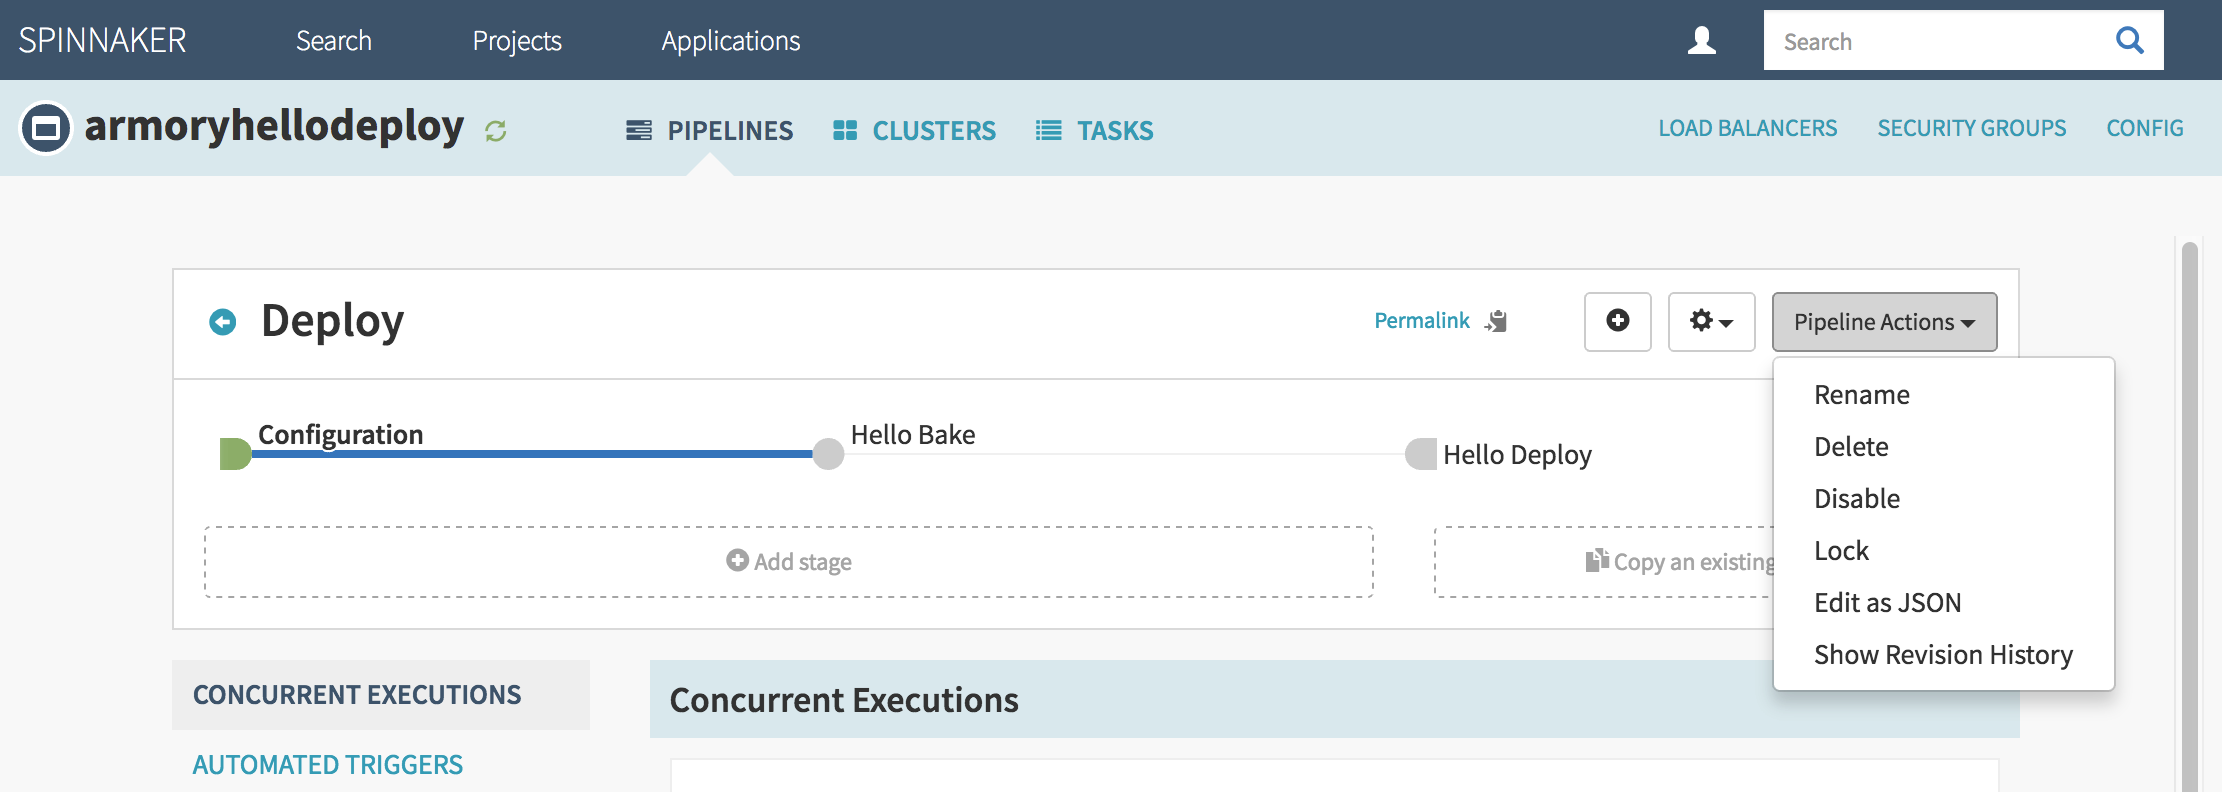
There are two JSON related options on this dropdown menu:
a. If you select ‘Edit as JSON’ then you should see something like:
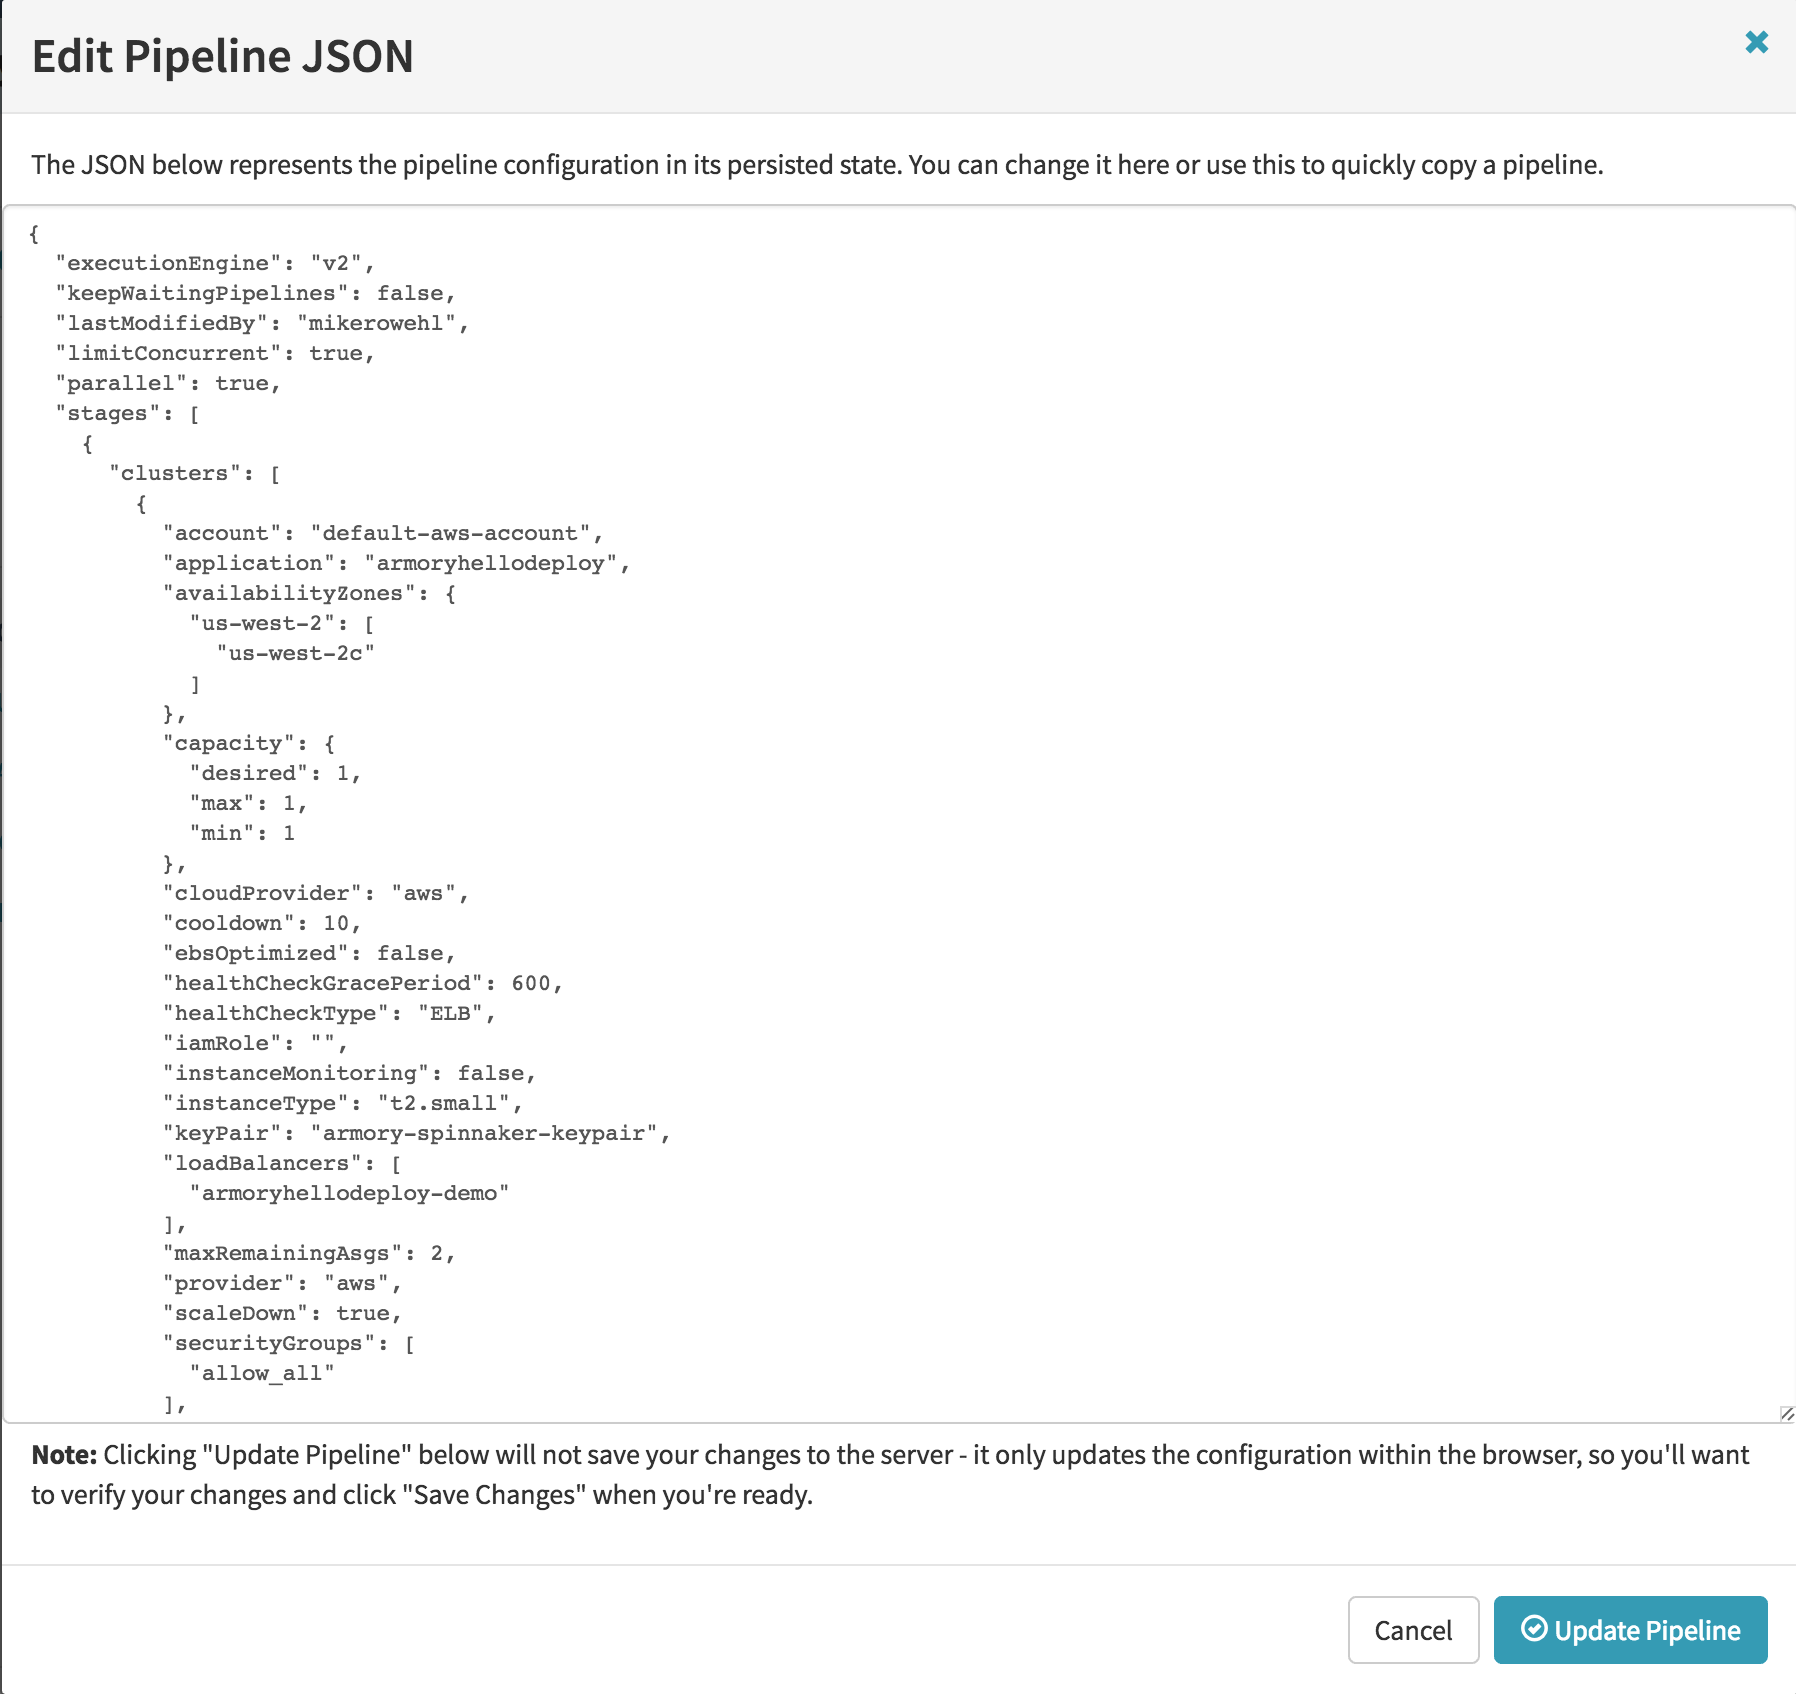
From this screen you can edit the JSON directly. Remember to always save your changes, so they will be used in the next execution of your pipeline.
b. If you select ‘Show Revision History’ then you should see something like:
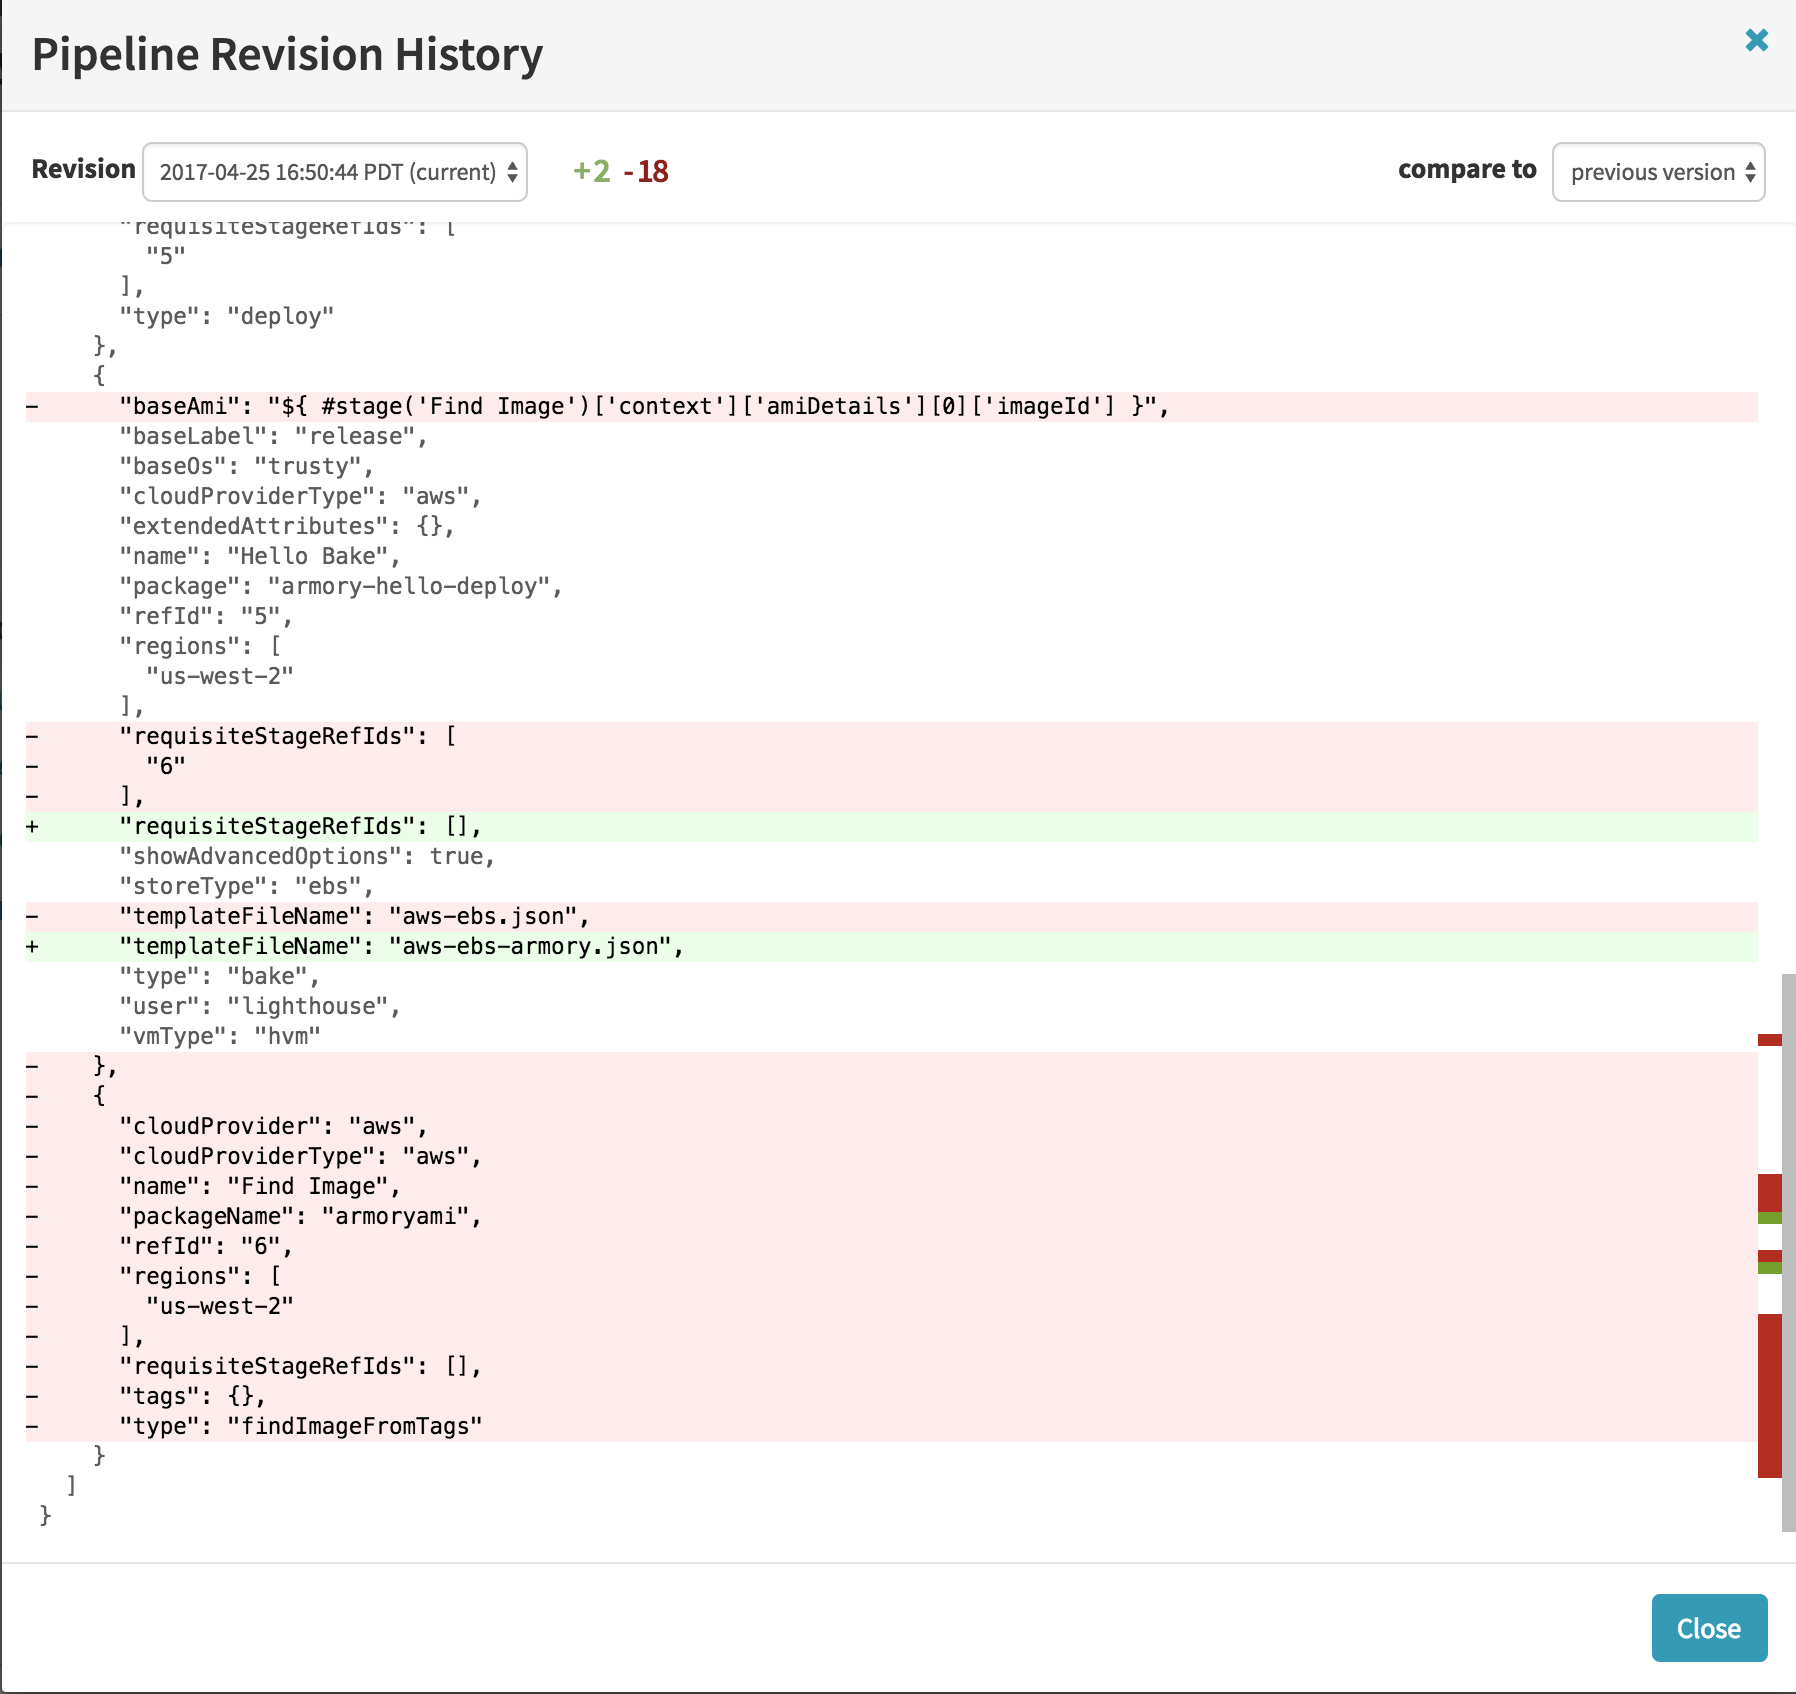
You can select different revisions using the dropdown menu labeled ‘Revision’ in the top left. You can compare it to different versions using the ‘compare to’ dropdown menu in the upper right.
Troubleshooting
Hanging or timed out pipelines
A lot of the time pipelines hang because of a misconfigured stage. This is a common occurrence when a server group does not complete its deploy because the deployed instances never pass the health check. This happens both when the health check is misconfigured and/or when the image doesn’t bake as expected. These two areas should be investigated first. For more information you can see the troubleshooting topic in the deployment guide.
Feedback
Was this page helpful?
Thank you for letting us know!
Sorry to hear that. Please tell us how we can improve.
Last modified October 17, 2023: (aa87b671)