Configure Support Diagnostics for Armory Continuous Deployment
Advantages to enabling Armory Diagnostics
When you engage Armory Support, the support team might ask you about enabling Armory Diagnostics. This sends the log and event data from the your system to Armory so that the support team can remotely investigate what might be going on with your system, resulting in a faster turnaround on solutions.
UUIDs are not checked for uniqueness. As a result, if you have two environments and you provide both with the same UUID, the logs sent to Armory will conflict with each other. Please ensure unique UUIDs for each environment.
Turning on Armory Diagnostics
Generate a unique UUID before adding the information. You can do this at a number of 3rd party websites that you can find via a Google search.
Add to your SpinnakerService.yml file:
spec:
  spinnakerConfig:
    config:
      armory:
        diagnostics:
          enabled:    true
          uuid:       # Enter uniquely Generated UUID
          logging:
            enabled:    # true/false to enable
            endpoint:   # Enter Endpoint, e.g. https://debug.armory.io/v1/logs
kubectl -n spinnaker apply -f spinnakerservice.yml
You can find a description of diagnostic parameters in the “Diagnostics Parameters” section of the Operator armory reference.
Migrating Diagnostics to Operator from Halyard
Follow the same steps as above, but you do not have to generate a UUID, as you already have one in your Halyard config. Please use the same UUID to ensure diagnostics continue.
What data gets sent to Armory
You’re probably wondering exactly what gets sent to Armory when you’re sharing your log output with us.
There are actually two streams of output that we will receive from an enabled
system. The first is the easiest, it’s a copy of what gets logged in the
pod (the same output you get from running kubectl logs -f <pod_id>). This
tends to be status messages, but we will also capture any software failures
that might have gotten caught. This often gives us the best insight into
why something is going wrong.
The second stream is actually the set of events being passed internally from Spinnaker microservice to microservice. These are JSON payloads that are then tagged on our side with your unique customer ID (so we can isolate your instances), a timestamp, and then two primary keys, “details” and “content”.
The Details key maps some very common elements for the event:
- application – The name of the Spinnaker application
- created – Timestamp of when the event was created
- requestHeaders – HTTP request headers for the internal request
- source – The microservice that generated the event (ex. ‘clouddriver’)
- type – An identifier as to what kind of event this was (ex.
orca:pipeline:starting)
The Content section is variable, and depends on what kind of event is being tracked. Here are some of the more common events:
Web access events contain your basic web event data, the request headers, URL, User Agent, encoding directives, etc.
Build events pass along the name of the build job (from Jenkins, Travis, etc), the success/failure, duration of the job.
Webhook events (like commits from Github) will contain whatever the webhook has sent along in its payload. For most SCMs, this is just the name of the organization, the repo name, a hash representing the commit, and a timestamp. If you’ve set up any other webhook events that you using to trigger Spinnaker, take care with what data is being sent.
Pipeline events will contain all the same data you would see in Spinnaker if you click on “Source” under a pipeline’s stage. This includes the name of the application, pipeline, the build information, the trigger information, and the status and results of all the stages included in that pipeline (including stages that have not been executed yet).
Other events may be the result of performing operations within Spinnaker, such as creating a new load balancer, or resizing a server group.
How Armory uses the data
Armory’s Technical Account Manager and Support teams may use this data to generate reports for customers and provide summary information to customers. Additionally, Armory may look at environment configuration data and view error logs in order to reduce resolution time on open support cases.
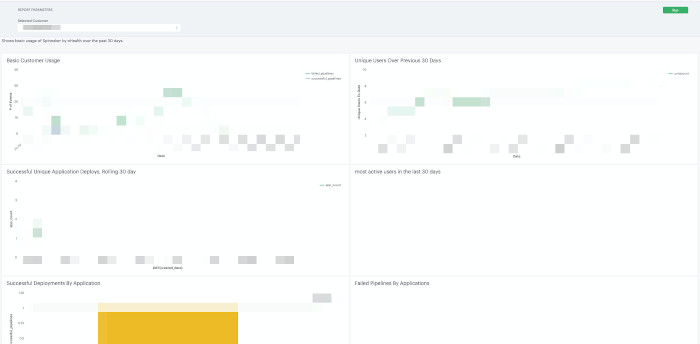
Technical Account Manager Report Example
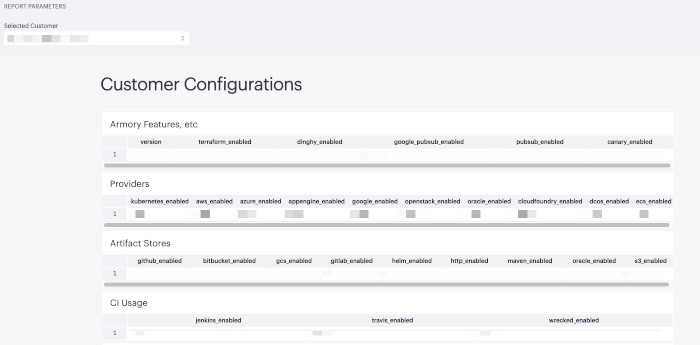
Customer Configuration Example
A Note on Private Data Exposure Risks
The data passed out of Spinnaker is based on payloads controlled by the open source Spinnaker community (except for those proprietary microservices provided by Armory specifically). Armory is not aware of any cases where private data (passwords, source code, etc.) would be passed out of Spinnaker as part of an event payload during normal operation. Armory is not responsible for secrets a customer has entered into an otherwise unprotected field being transmitted (for example, entering a password into a “Notes” field of a pipeline stage).
Feedback
Was this page helpful?
Thank you for letting us know!
Sorry to hear that. Please tell us how we can improve.
Last modified December 6, 2023: (c369a5f8)