Armory Continuous Deployment Monitoring Indicators
Common Metrics - All Services
Service Level Indicators (SLI)

For all java based services, Spinnaker exposes common metrics like HTTP and JVM ones.
Controller latency
sum(rate($service:controller:invocations__totalTime_total[1m])) by
(controller, method) / sum(rate($service:controller:invocations__count_total[1m])) by
(controller, method)
→ Y axis is in nanoseconds.
To get milliseconds:
totalTime query / 1000000 / count query
Indicates how long it takes for each HTTP controller to respond.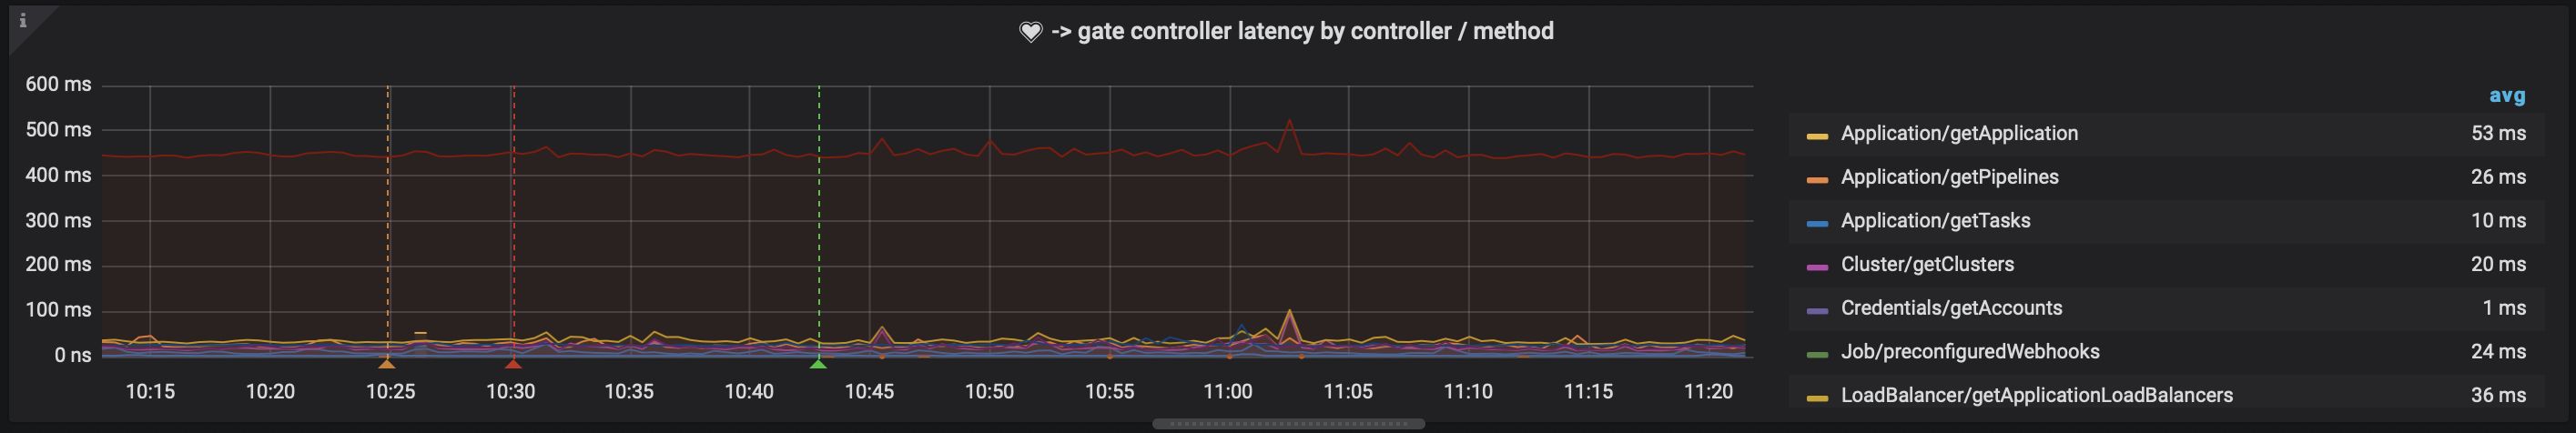
Service Level Objective (SLO): Average rate below 10 seconds.
Troubleshoot: Determine if slowness is caused by downstream, external services or by the affected service itself, by looking at other metrics.
Outgoing requests latency
sum(rate($service:okhttp:requests__totalTime_total[1m])) by (requestHost) / sum(rate($service:okhttp:requests__count_total[1m])) by (requestHost)
→ Y axis is in nanoseconds.
To get milliseconds:
totalTime query / 1000000 / count query
Shows how long it takes for downstream Spinnaker services to respond.
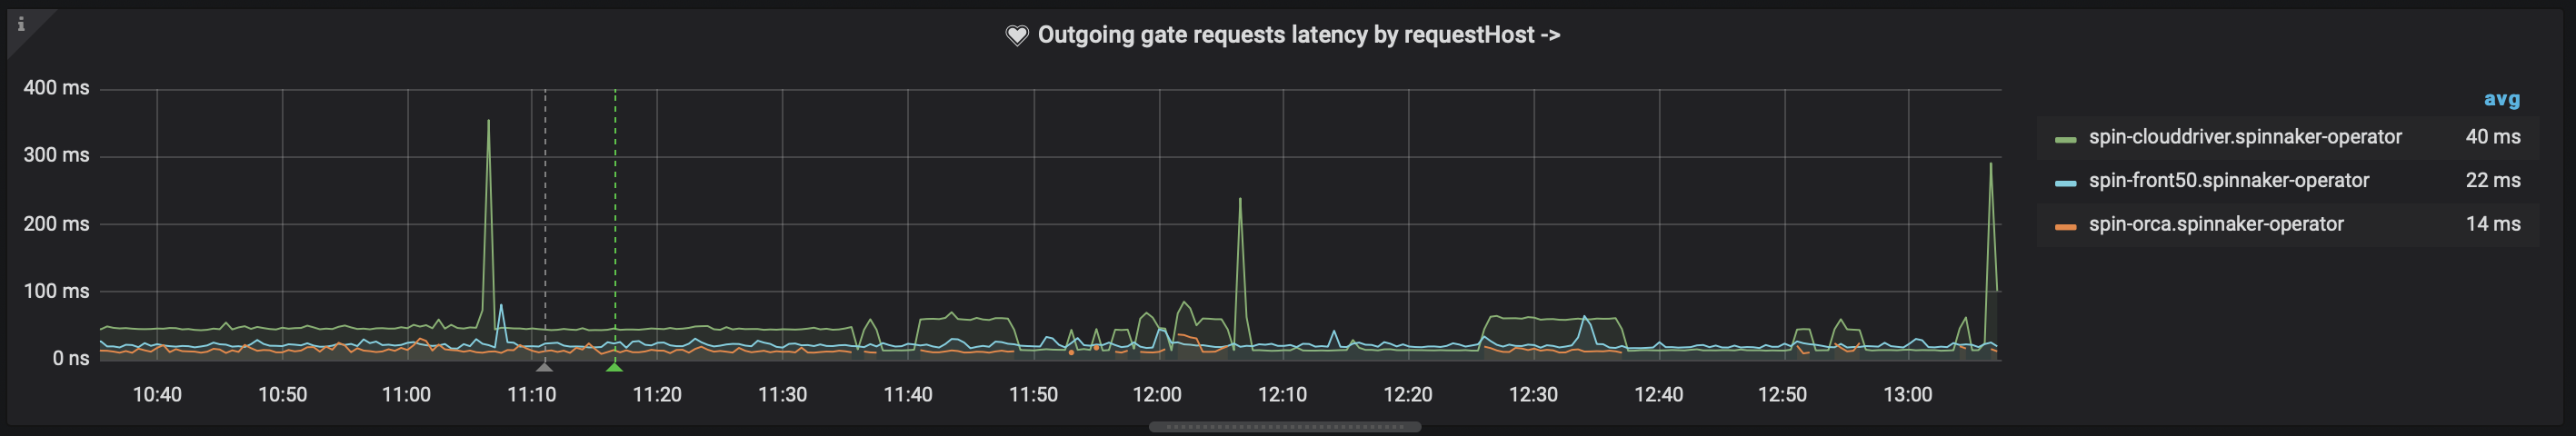
SLO: Average rate below 10 seconds.
Troubleshoot: Look at specific metrics of slow service.
5xx errors sent
sum(rate($service:controller:invocations__count_total{status="5xx"}[1m])) by
(controller, method, statusCode)
Indicates the number of 5xx errors produced by the service.
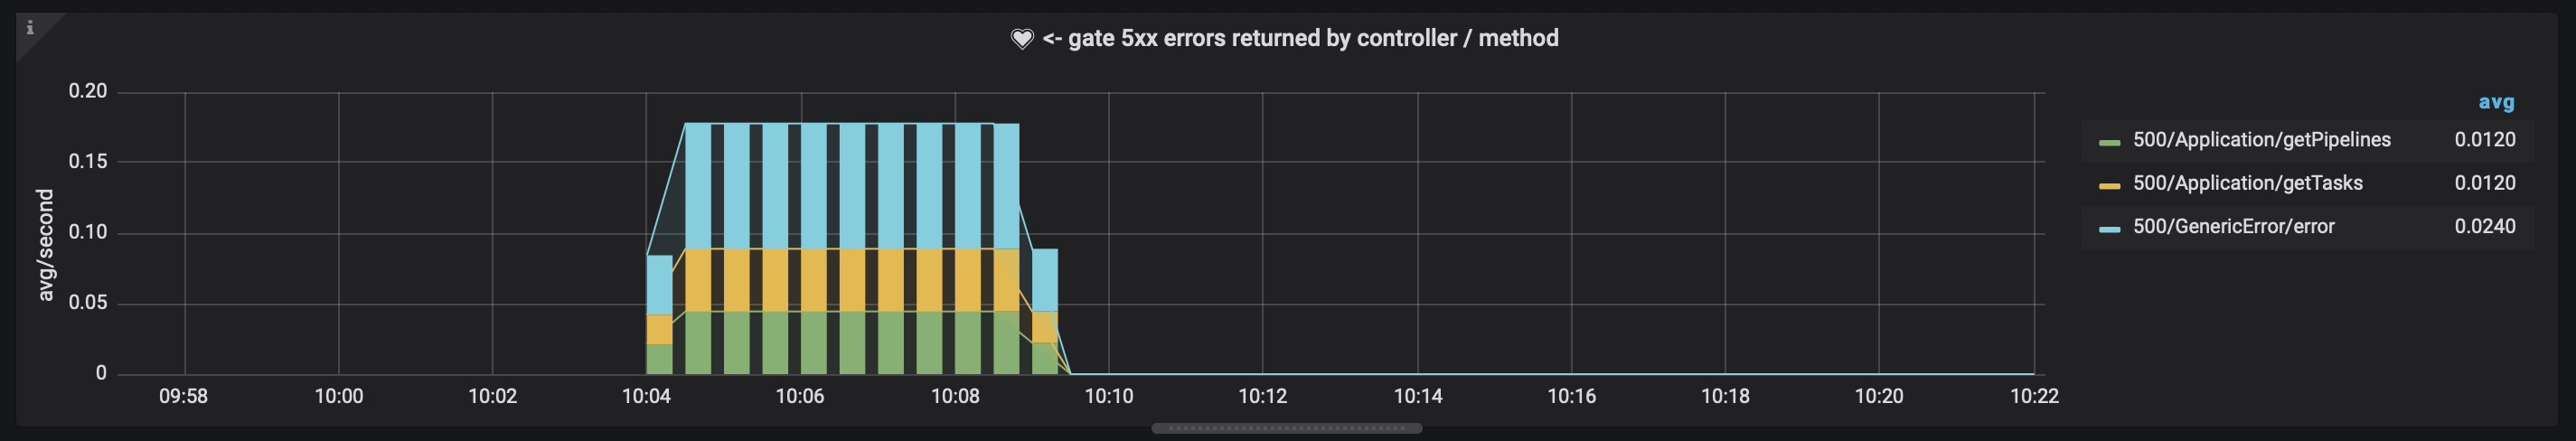
SLO: Average rate below 0.25 errors per second.
Troubleshoot: Investigate in logs and metrics for other services, if the errors are caused in the affected service or by downstream, external services.
5xx errors received
sum(rate($service:okhttp:requests__count_total{status="5xx"}[1m])) by
(requestHost)
Shows the number of errors received from other Spinnaker services.

SLO: Average rate below 0.25 errors per second.
Troubleshoot: Look at logs and metrics of the service throwing the errors.
Hystrix fallbacks
sum(rate($service:hystrix:countFallbackSuccess[1m])) by (metricGroup, metricType)

sum(rate($service:hystrix:countFallbackFailure[1m])) by (metricGroup, metricType)

sum(rate($service:hystrix:isCircuitBreakerOpen[1m])) by (metricGroup, metricType)
Not all services have Hystrix. It is a disaster recovery library, meaning that if the original request to an external service fails, Hystrix will execute a “Plan B” to produce an acceptable response. If errors accumulate and the downstream service is still not healthy, Hystrix circuit breaker opens and errors start to flow upstream.
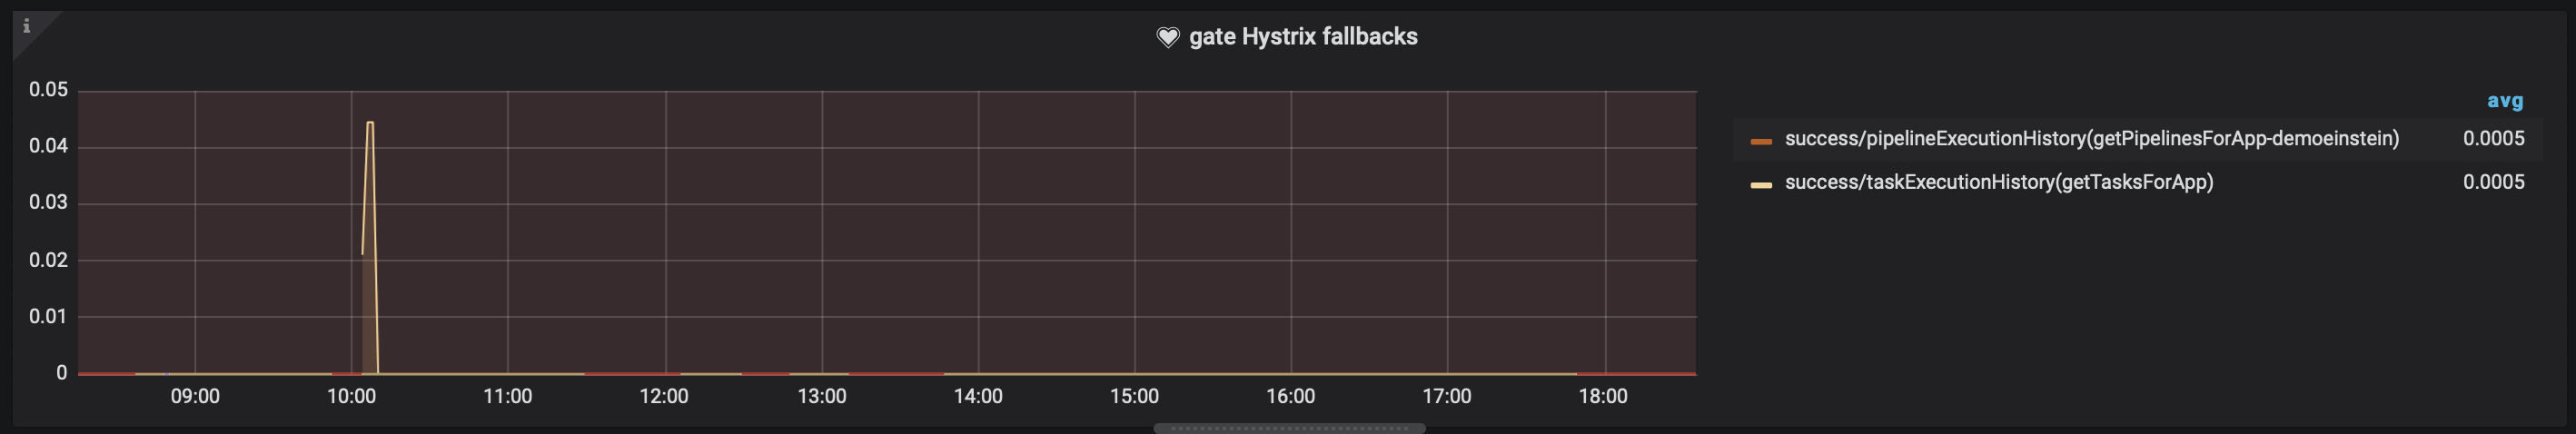
SLO: Average rate below 0.10 Hystrix events per second.
Troubleshoot: Investigate log files of affected service, it’s possible that downstream external services are either failing or are too slow to respond. Look at “Outgoing requests latency” metric.
JVM memory usage
sum($service:jvm:memory:used{memtype="HEAP"}) by (instance)
Shows memory consumption of a java based service.
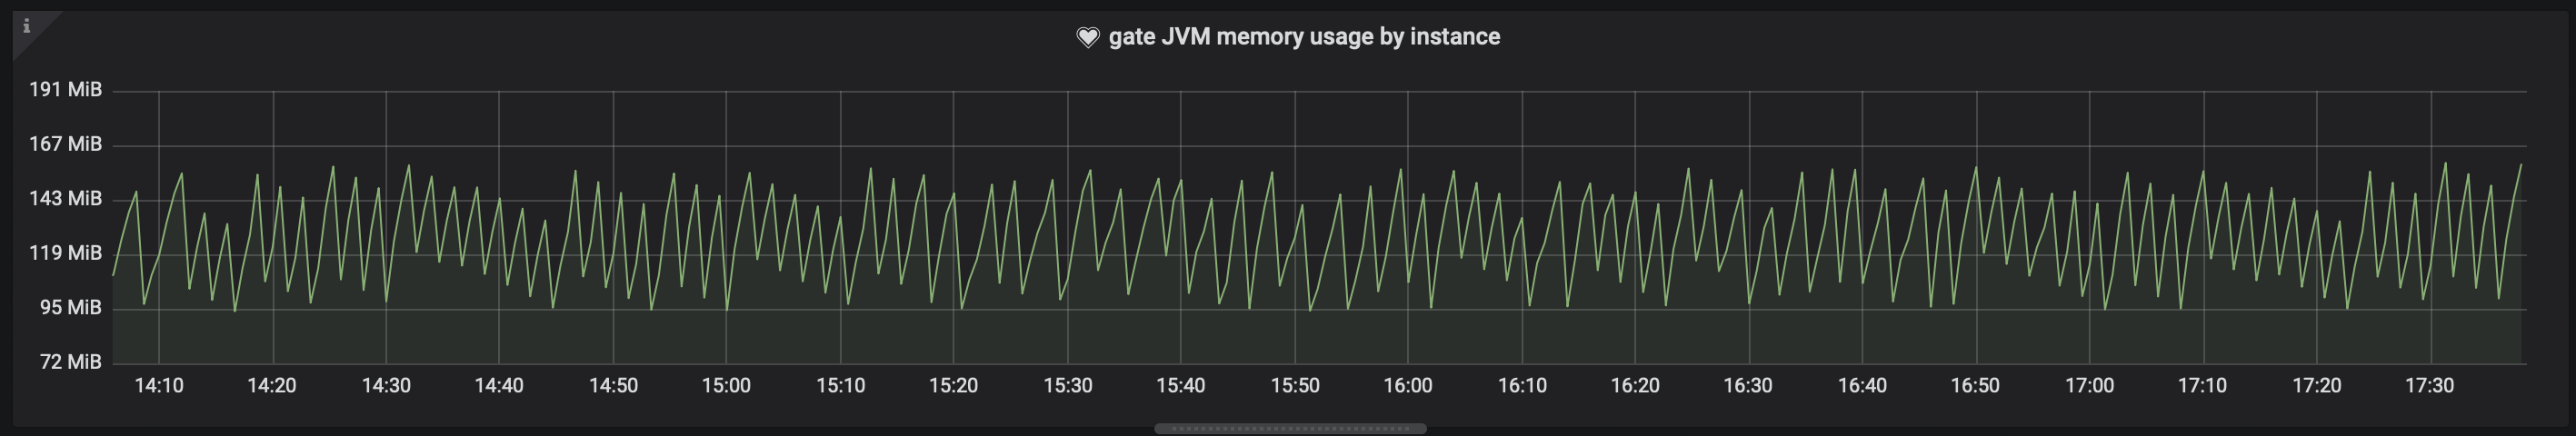
SLO: No pods restarting due to OutOfMemory errors.
Troubleshoot: There’s no ideal value identified, but pod memory requests/limits MUST be 2x max JVM heap value. This is because services use -XX:MaxRAMFraction=2 flag, which means that the JVM memory will be limited to take at most half of the available RAM to the pod. For example if the pod memory request/limit is 2GB, the java service will take up to 1GB before OutOfMemory errors appear and the container gets killed. Increase pod memory requests/limits.
Configurations affecting performance
OkHttp client timeout
Add the following config to profiles/<service>-local.yml (such as clouddriver-local.yml) to change the default timeout of the OkHttp client. This can be a temporary, quick workaround to fix increased 5xx errors and Hystrix fallbacks.
ok-http-client:
 connectTimeoutMs: <TIMEOUT MS>
 readTimeoutMs: <TIMEOUT MS>
JVM memory requests/limits
Example in main hal config:
deploymentEnvironment:
  customSizing:
   spin-clouddriver:
    requests:
     memory: 8Gi
    limits:
     memory: 8Gi
Clouddriver Metrics
Average caching agent time
avg(label_replace(
 delta(clouddriver:executionTime__totalTime_total{}[1m])
, "agentType", "$1", "agent", "^.*/(\\w+)\\[.*$")) by (agent)
Indicates how long it takes for clouddriver caching agents to complete a caching cycle.

SLO: Max time below 1 minute.
Troubleshoot: Usually caching cycles are done every 30 seconds. Caching time can be improved by increasing clouddriver pods and memory/cpu requests and limits. Number of pods are related with number of caching threads. More pods, more caching threads can be used to balance workload among pods. Example:
providers:
  kubernetes:
   accounts:
   - kubernetes
    cacheThreads: 3
----------------
 deploymentEnvironment:
  customSizing:
   spin-clouddriver:
    replicas: 5
Also using SQL instead of Redis may improve caching agent times. When this metric is too high, it can cause “Deploy (Manifest)” stage to last 12 “Force Cache Refresh task during deployments taking up to 12 minutes to complete. Long Cloudddriver startup times if it checks for permissions on startup (more than 30 minutes). 500 timeouts on UI during deployments.
Number of caching agents
count(label_replace(
 delta(clouddriver:executionTime__totalTime_total{}[1m])
, "agentType", "$1", "agent", "^.*/(\\w+)\\[.*$")
) by (agent)
Shows how many caching agents are running in clouddriver.
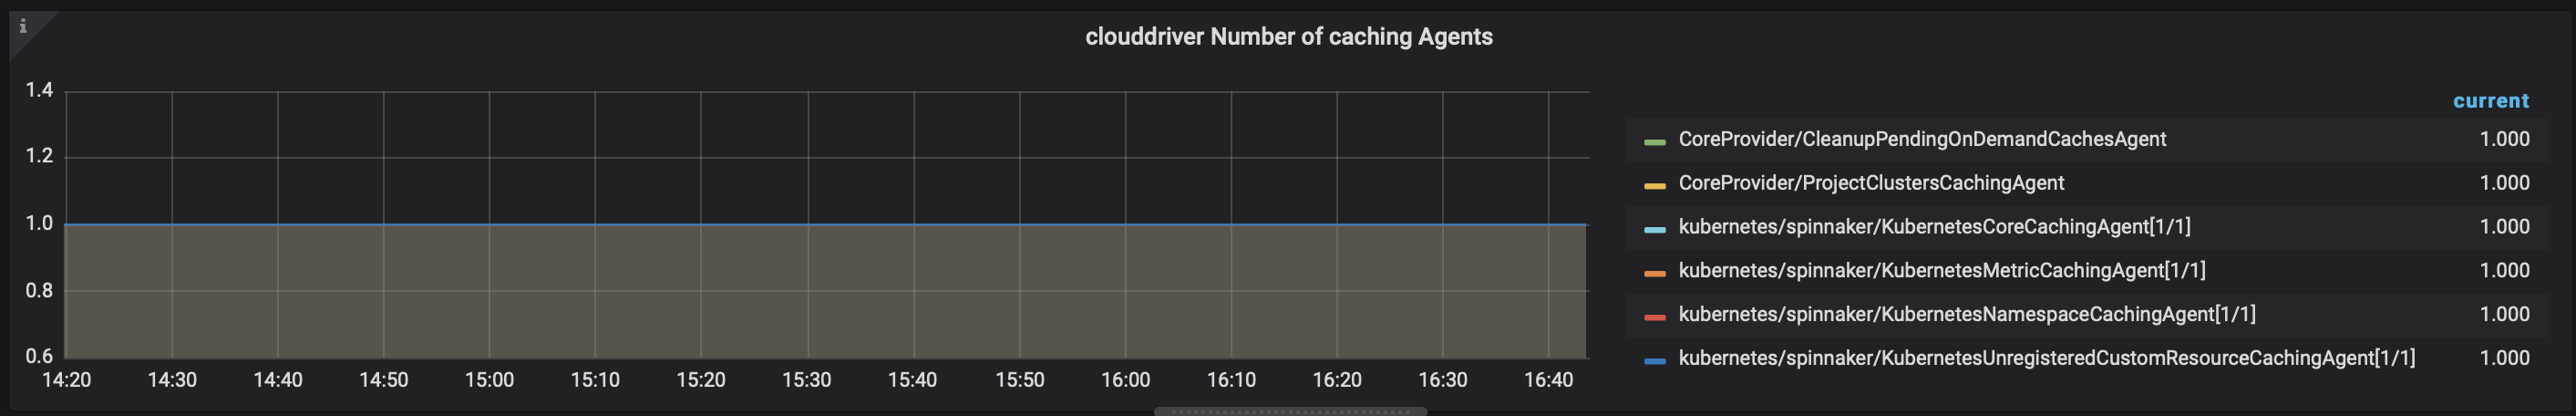
SLO: No deviation in time, the number of agents should stay constant.
Troubleshoot: When this metric varies it typically means a pod was killed.
Kubernetes, kubectl latency
sum(rate(clouddriver:kubernetes:api__totalTime_total{success="true"}[1m])) by
(account, action) / sum(rate($service:kubernetes:api__count_total{success="true"}[1m])) by
(account, action)
→ Y axis is in nanoseconds.
To get seconds: totalTime query / 1000000000 / count query
Shows how long kubectl takes for completing requests like kubectl get.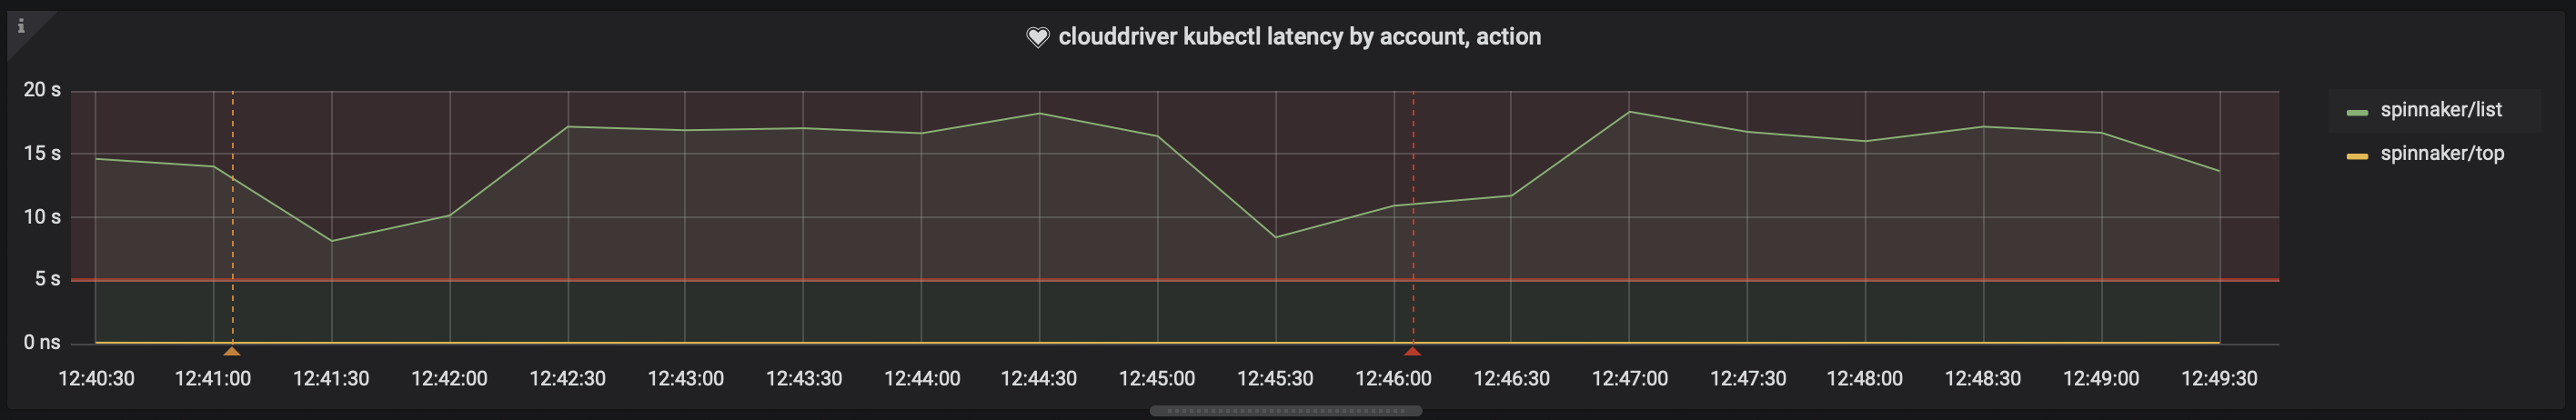
SLO: This metric is impacted by the target Kubernetes cluster and is not directly responsibility of Spinnaker, but a latency below 5 seconds average is good.
Troubleshoot: You can log in to clouddriver pod and list processes, there are likely kubetcl running processes from which you can grab the full command used by clouddriver:
bash-4.4$ ps -f | cat
PID USER  TIME COMMAND
17103 spinnake 0:00 kubectl --kubeconfig=/Users/german/.hal/default/staging/dependencies/1062698630-kubecfg-german --namespace=istio-system -o json get configMap,controllerRevision,cronJob,daemonSet,deployment,event,horizontalpodautoscaler,ingress,job,limitRange,networkPolicy,persistentVolumeClaim,pod,podDisruptionBudget,replicaSet,role,roleBinding,secret,service,serviceAccount,statefulSet
If you repeat this command with --v=10 flag, you’ll get all requests, responses and internal cache hits done by the command. From there, you can know where’s spending most of the time. kubectl has an internal cache expiring every 10 minutes or so in ~/.kube.
Output of the kubectl --v=10 get xxx command can be analyzed with this script.
AWS failed requests
sum(rate(clouddriver:aws:request:requestCount_total{error="true"}[1m])) by (AWSErrorCode, requestType)
Indicates the amount of failed requests from Spinnaker to AWS infrastructure.
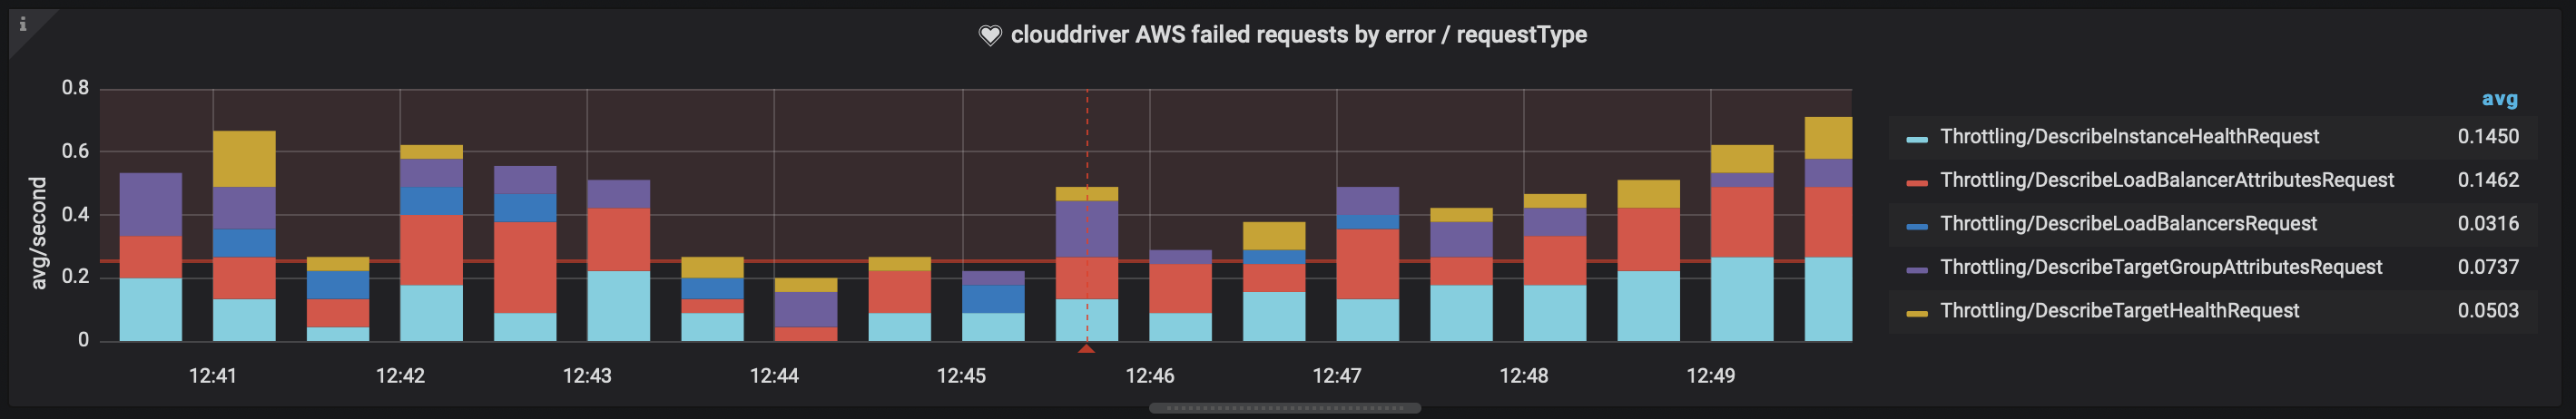
SLO: Average rate below 0.10 errors per second.
Troubleshoot: Adjust Cloudddriver rate limits.
SQL blocked connections
clouddriver:sql:pool:default:blocked{}
Shows how many SQL connections are hanging waiting for processes to complete.
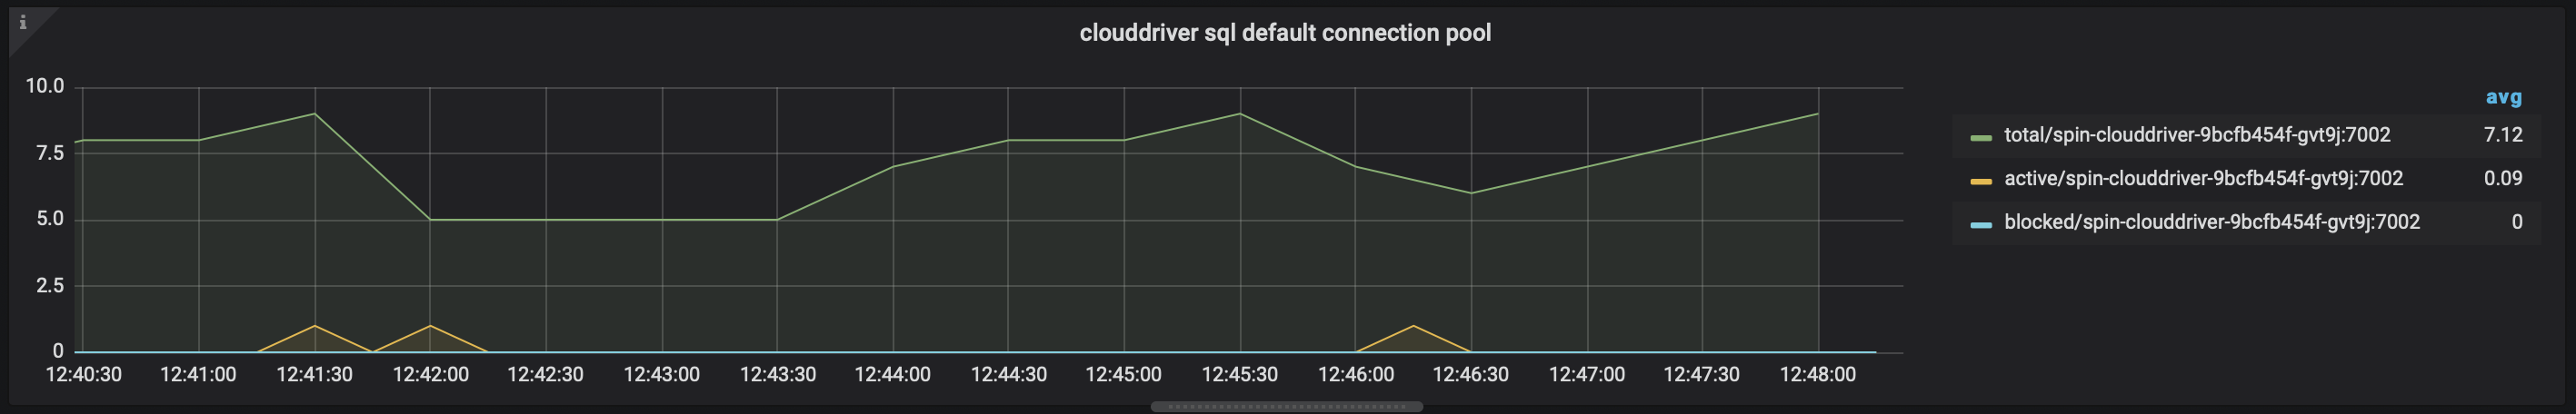
SLO: Zero blocked connections.
Troubleshoot: Take a look at database provider specific metrics to see if database is reaching maximum resource capacity, or maximum number of allowed concurrent active connections.
Redis latency
sum(rate(clouddriver:redis:command:latency:sscan__count_total[1m])) /
sum(rate(clouddriver:redis:command:latency:sscan__totalTime_total[1m]))
There are around 10 different redis actions and each one has its own metric. This is the time it takes for a redis read or write operation to complete.
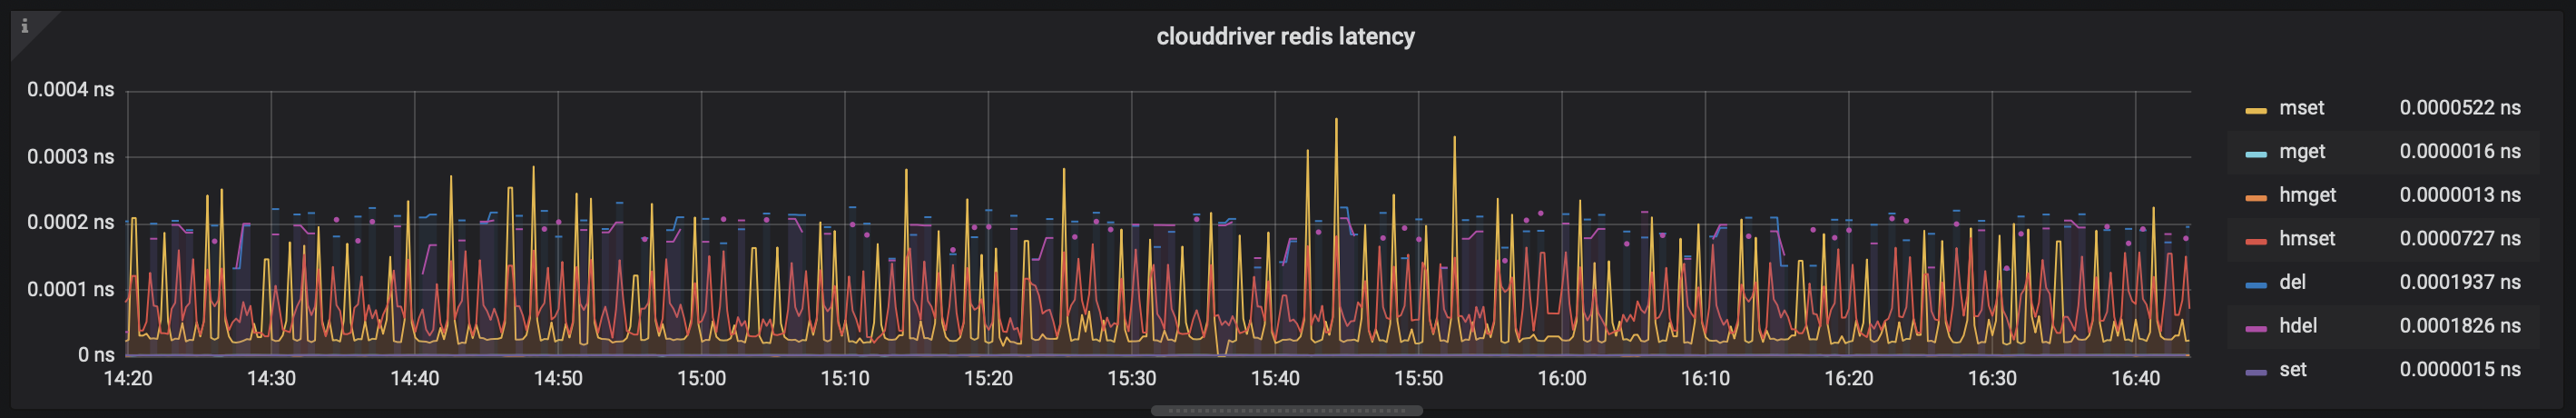
SLO: Average rate below 100 milliseconds.
Troubleshoot: Investigate overall network latency from clouddriver to redis, and if redis is reaching its capacity limit.
Configurations affecting performance
checkPermissionsOnStartup
Kubernetes account level. When set to false, clouddriver startup time is much faster because permissions are checked on demand. Bad side effects: unknown.
liveManifestCalls
Kubernetes account level. When set to true, “Force Cache Refresh” task during Deploy stage execution is reduced to zero, because Spinnaker will not try to refresh the cache to check if the manifest was deployed. Bad side effects: many more kubectl calls than needed during deployments. Ideally this flag should always be false (default).
cacheThreads
Kubernetes account level. This should only be increased when the number of pods increases, it allows to spread the load of caching across different pods and threads.
metrics
Kubernetes account level. When set to false, Spinnaker will not try to constantly retrieve memory and cpu usage of each and every pod, reducing the caching cycle time of the metrics caching agent to almost zero. Side effects: on Infrastructure screen, when you click a pod, on the right side panel there’s information about its cpu/memory usage. When this flag is set to false, those values show as unknown.
replicas
deploymentEnvironment.customSizing.<service>.replicas. Indicates the number of pods for each service.
cpu/memory requests/limits
deploymentEnvironment.customSizing.<service>.requests.cpu, deploymentEnvironment.customSizing.<service>.limits.cpu. Indicates the max value for cpu and memory usage for pods.
onDemandClusterThreshold
File: default/profiles/settings-local.js setting: window.spinnakerSettings.onDemandClusterThreshold. This is a Deck setting that controls the threshold at which the Infrastructure screen will change to not show all server groups at the same time, and instead show a dropdown to select the server group to show. This setting has a huge impact on improving performance because the get server groups call is usually one of the most expensive ones, and is done periodically as long as the UI is open.
max-concurrent-agents
File: clouddriver-local.yml
redis.agent.max-concurrent-agents, default: 1000.
sql.agent.max-concurrent-agents, default: 100.
This is the maximum amount of caching agents running simultaneously. Limiting this value may benefit to avoid having spikes of high resource usage, specially when clouddriver handles a lot of accounts. Example for kubernetes provider: having 10 accounts and 5 max agents, will spawn a maximsuum of 5 kubectl simultaneous calls, whereas using the default value may spawn 10 * 2 = 20 simultaneous kubectl calls, because each account has at least a CoreCachingAgent and a CustomResourceDefinition caching agent.
jobs.local.timeout-minutes
File: clouddriver-local.yml
jobs.local.timeout-minutes . Default: 10. The maximum amount of time for spawned kubectl processes to finish before being killed. A change is proposed to Spinnaker 1.24 to send a SIGKILL signal to those processes (kill -9) instead of just the usual SIGTERM, which may still leave misbehaving kubectl processes running.
Feedback
Was this page helpful?
Thank you for letting us know!
Sorry to hear that. Please tell us how we can improve.
Last modified March 3, 2023: (22c29bf4)