Use Automatic Canary Analysis in Spinnaker
Overview of Kayenta for automated canary analysis
Kayenta is the Spinnaker service that performs automated canary analysis. The goal of Kayenta is to provide the end user with confidence that a deployment is safe through automation and intelligence.
Kayenta uses real-time data sources to validate that a canary is good or bad. Kayenta supports the following real-time data sources:
- DataDog
- Stackdriver (Google)
- Prometheus
- New Relic
- Dynatrace
- AWS CloudWatch
Before you begin
Before you can start using canary deployments, you need to enable Kayenta, the SpinnakerTM service for canary deployments. For more information, see the Configure Automated Canary Deployments in Spinnaker guide.
Configuring Kayenta on an app
When Kayenta is enabled for your instance, you should see a Canary option in your app’s config section:
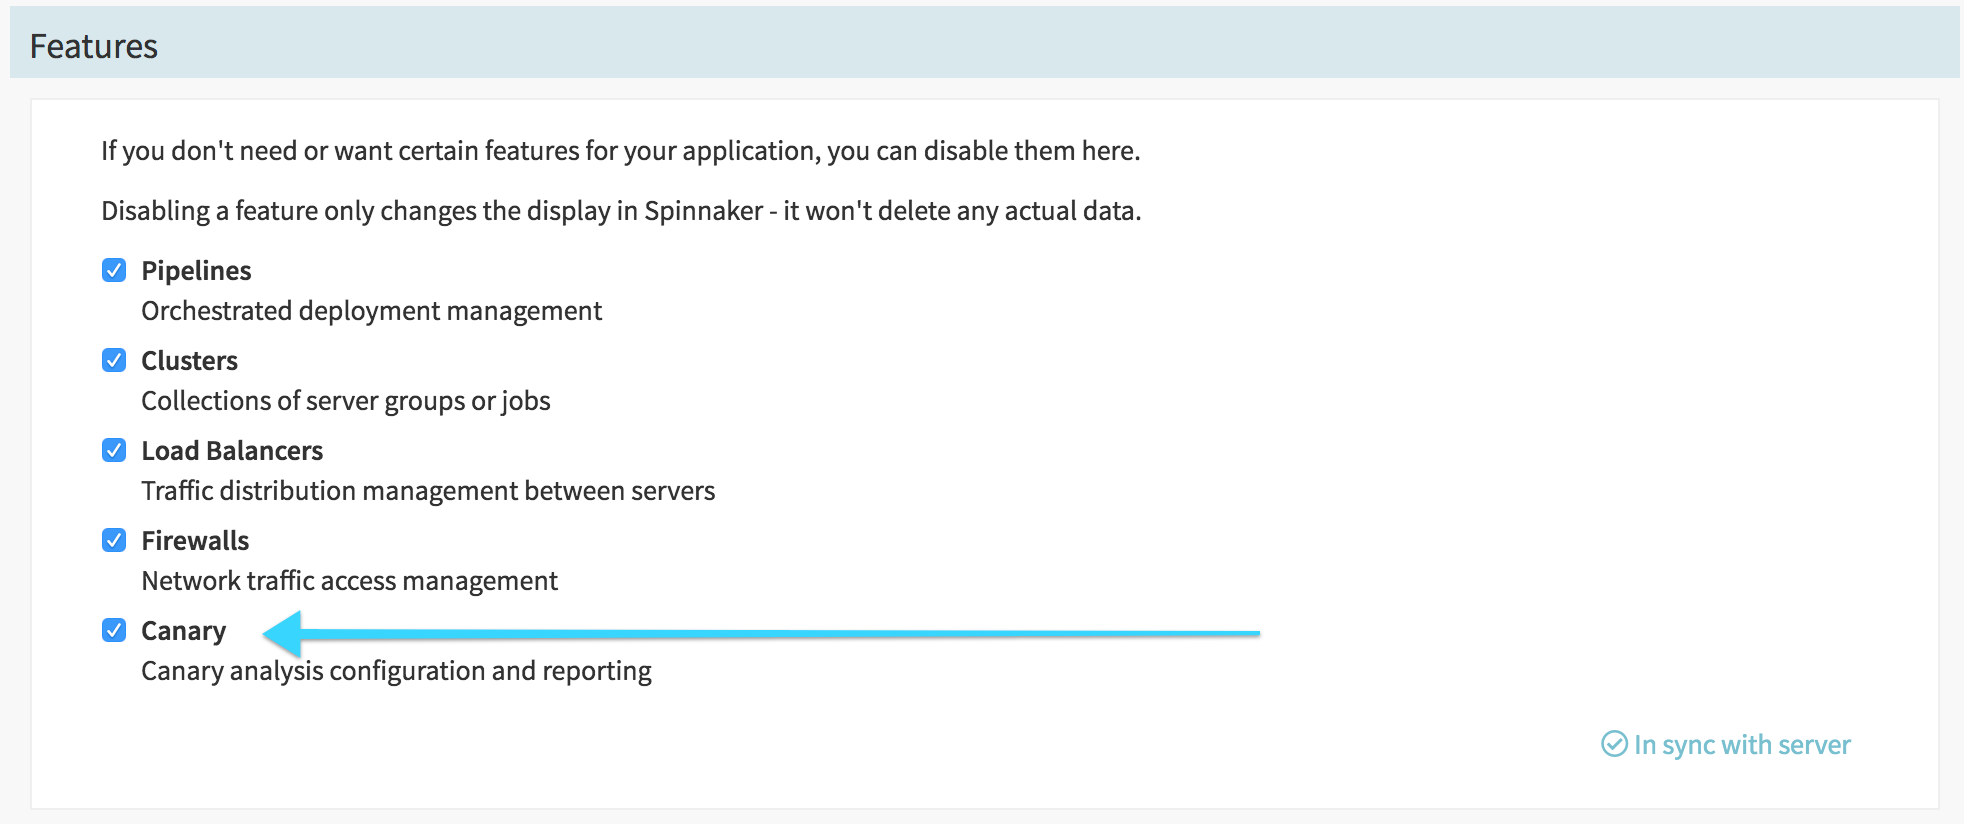
Check Canary and save.
If you don’t see this option in your application config, make sure you’ve configured Kayenta.
You can also find more information about Kayenta in Automated Canary Deployments.
Canary configs
You may need to refresh your browser page to see your changes.
Your menubar should show Delivery and you should see the option for Canary Configs as a hover, or as a submenu element:
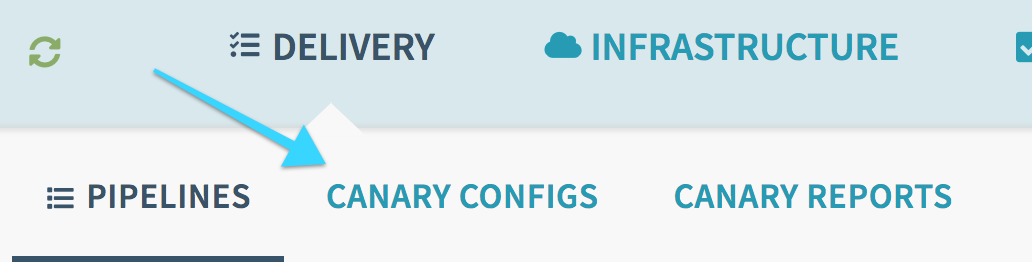
Click on Canary Configs and Add configuration. You should see form similar to this:
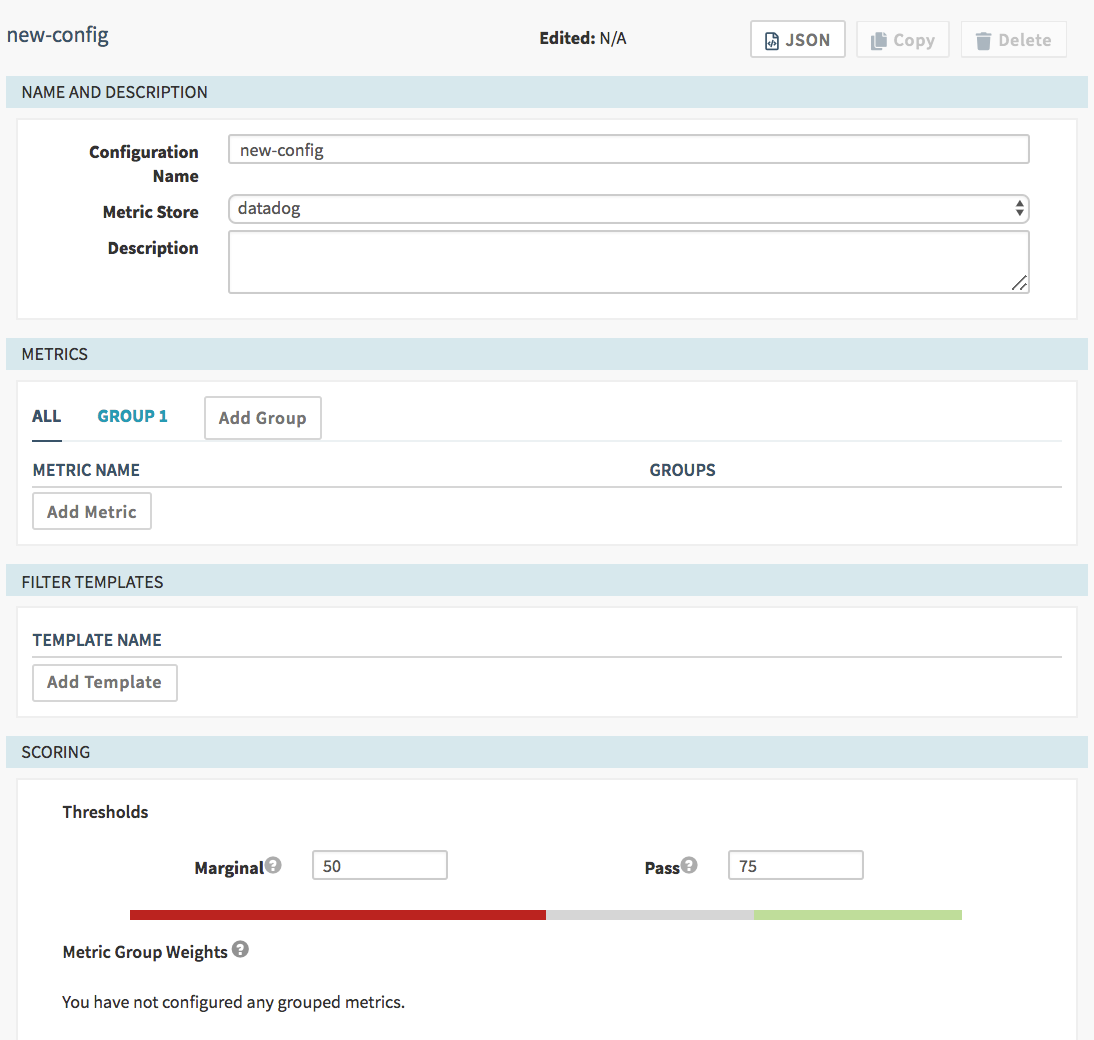
Configuration Name: Spaces are not allowed, only alphanumerics, hyphens and underscores. This name is displayed as an option in the canary stage configuration later, so choose a meaningful name.
Metric Store: If you only configured one metrics store, this is set for you. Otherwise, you can choose from the options. The default is the one you referenced in the environment file.
Description: Free form text to help your coworkers know what this canary is doing.
If you see the following error The was an error saving your config: 400 when you are trying to save your canary config, add the following setting in your SpinnakerService manifest:
apiVersion: spinnaker.armory.io/v1alpha2
  kind: SpinnakerService
  metadata:
    name: spinnaker
  spec:
    spinnakerConfig:
      profiles:
        gate:
          services:
            kayenta:
              canaryConfigStore: true
Groups
A Canary Config can contain multiple groups of metrics, and each group can contain multiple metrics. By default “Group 1” is set up for you to add to; you can rename the group by clicking on the group and then clicking on the pencil icon next to it.
A group that has no metrics in it will be removed when the configuration is saved. If you create an extra group or want to delete an existing one, just be sure you’ve removed all the metrics from that group before saving.
Grouping is used to add different weights to the importance of different metrics or groups of metrics (see “Scoring” below).
Add metric
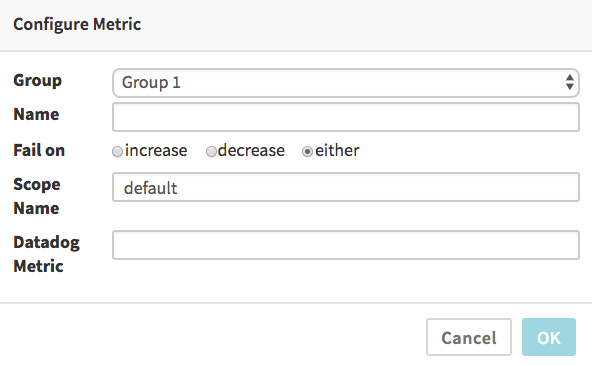
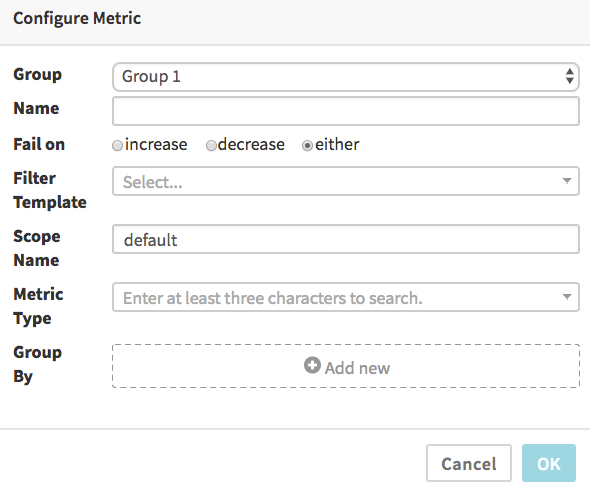
When you add a metric, the UI will be slightly different depending on what Metric Store you selected earlier. The DataDog dialog looks like:
The Stackdriver dialog looks like:
The New Relic dialog looks like: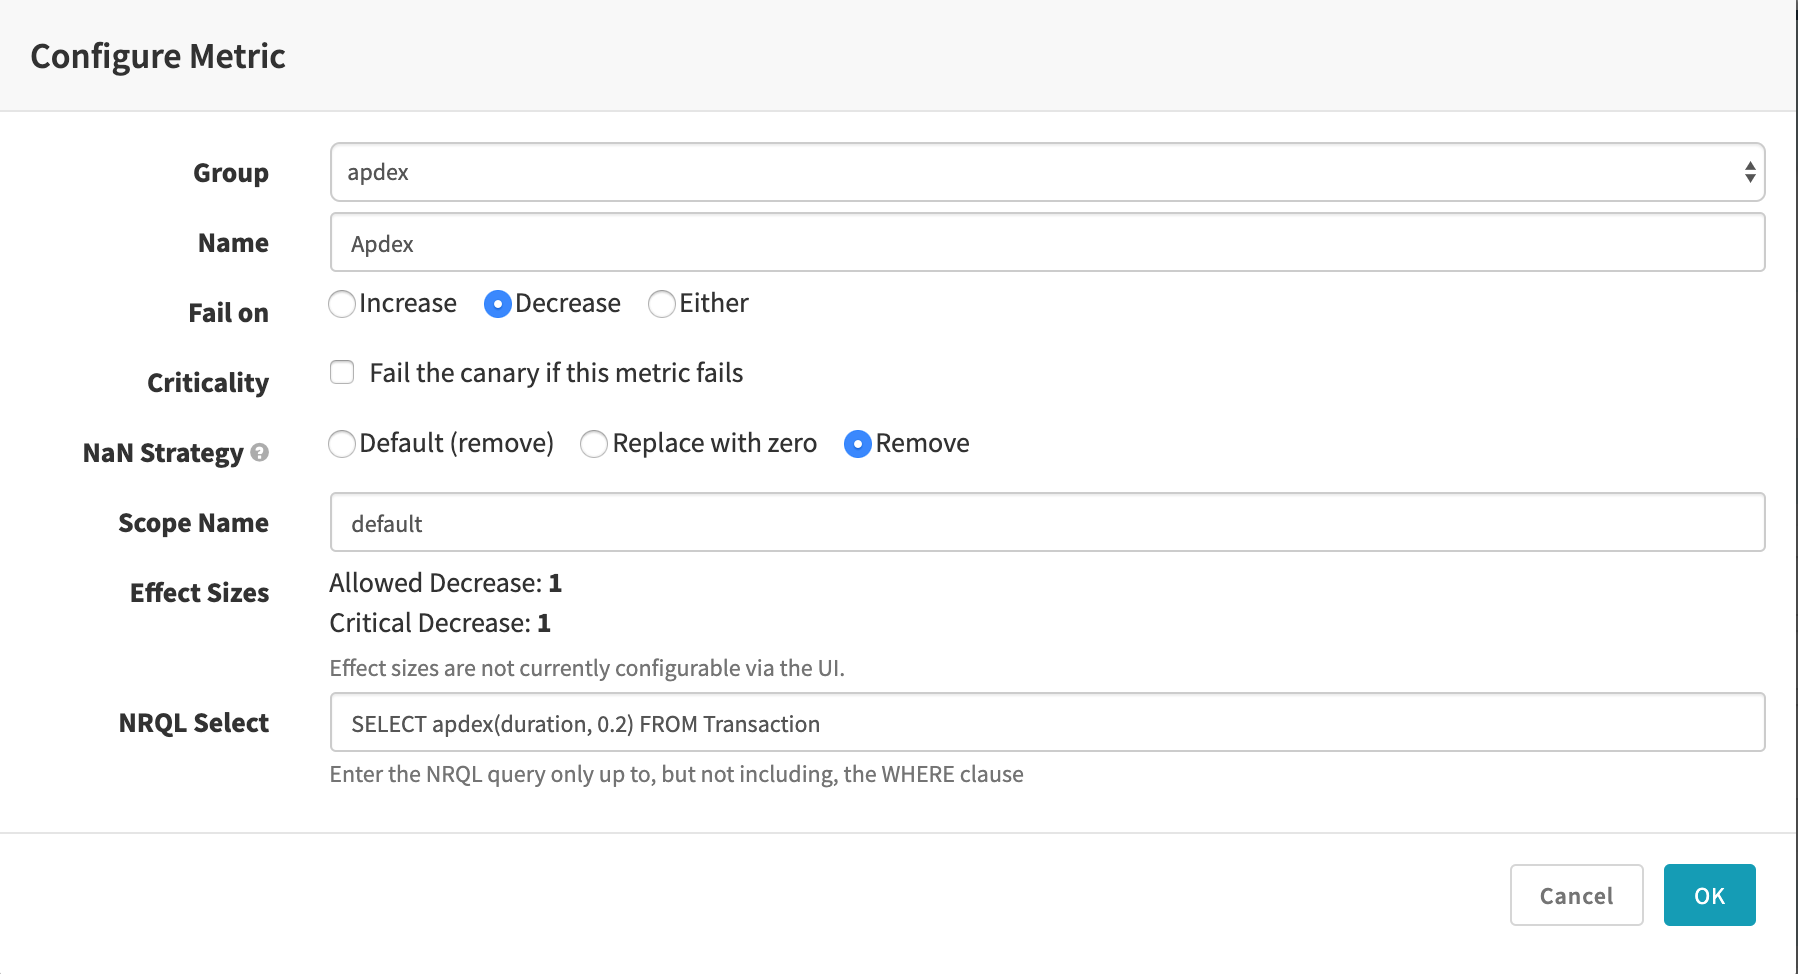
In all cases, the Name is free-form and used to label the results and graphs.
By default the “Fail on” selection of “either” means the comparison of canary and baseline metrics will be marked as a failure if the canary’s data is either significantly greater or less than the baseline’s data. You can select “increase” if you only want to fail when the canary’s metrics are significantly higher than the baseline (useful for things like error counts, memory and CPU usage, etc, where a significant improvement is not a failure), or, conversely, select “decrease” for the opposite (useful for metrics that measure things where bigger numbers are always better).
DataDog metrics
For DataDog, the metric is simply the aggregation function you wish to use (avg, min, max, sum), a colon, and the name of the metric. You can use the DataDog Metrics Explorer to find these names:
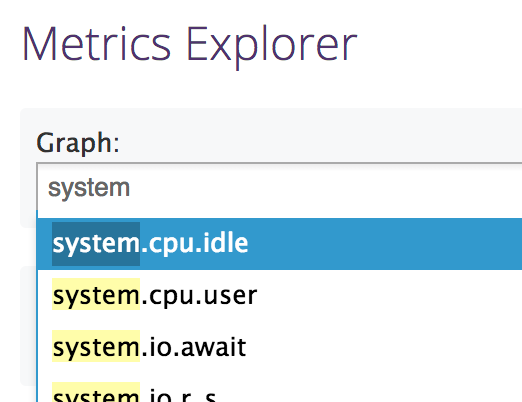
For example, if you wanted to measure the average amount of CPU used, you could
enter avg:system.cpu.user.
Stackdriver metrics
Please refer to the Spinnaker Kayenta documentation for information on configuring Stackdriver metrics.
New Relic metrics
Use a NRQL Select statement (without the WHERE clause) to specify the metric to measure. You can use New Relic Insights to find the available events and metrics. Please refer to the NRQL documentation for more information.
Filter templates
Please refer to the Spinnaker Kayenta documentation for information on configuring Filter Templates. They are completely optional and may not be necessary for your application.
Scoring
After adding some metrics to groups, you should see each non-empty groups in this section, with scores defaulted to “0”. You’ll need to edit these scores to sum to 100 (if you’ve only created a single group, just set it to 100).
When the canary runs for a given interval, all the metrics are evaluated and each metric is given a pass/fail based on the deviation from the baseline metric. Within a group, each metric is evenly balanced (so if a group has two metrics, and one fails and one passes, the group is scored at 50%; if it had only one metric, it would score either 100% for a pass or 0% for a fail).
Each group is then scored their Metric Group Weight proportional to the success of the metrics in the group. A group with a weight of 40 and a 50% failure rate would score a total of 20 (50% of 40). The score of each group is added together for a final interval score. It’s this total score that is compared to the Thresholds evaluation. If the total is above the “Marginal” level, the canary will continue to run; if it’s less than the Marginal level, the canary will stop and record a failed stage immediately.
If the canary runs to completion, and all the intervals scored above “Pass”, the stage will be considered a success. If any interval fell into the grey area between Marginal and Pass, the stage will end with a failure, although it will not have been pre-emptively cancelled. This is intended to allow someone to look at the marginal responses and make their own evaluation of whether or not the pipeline should continue.
Configuring a Canary Analysis stage
If everything is configured properly, you should be able to create a stage of Type “Canary Analysis”. The stage form should look like this:
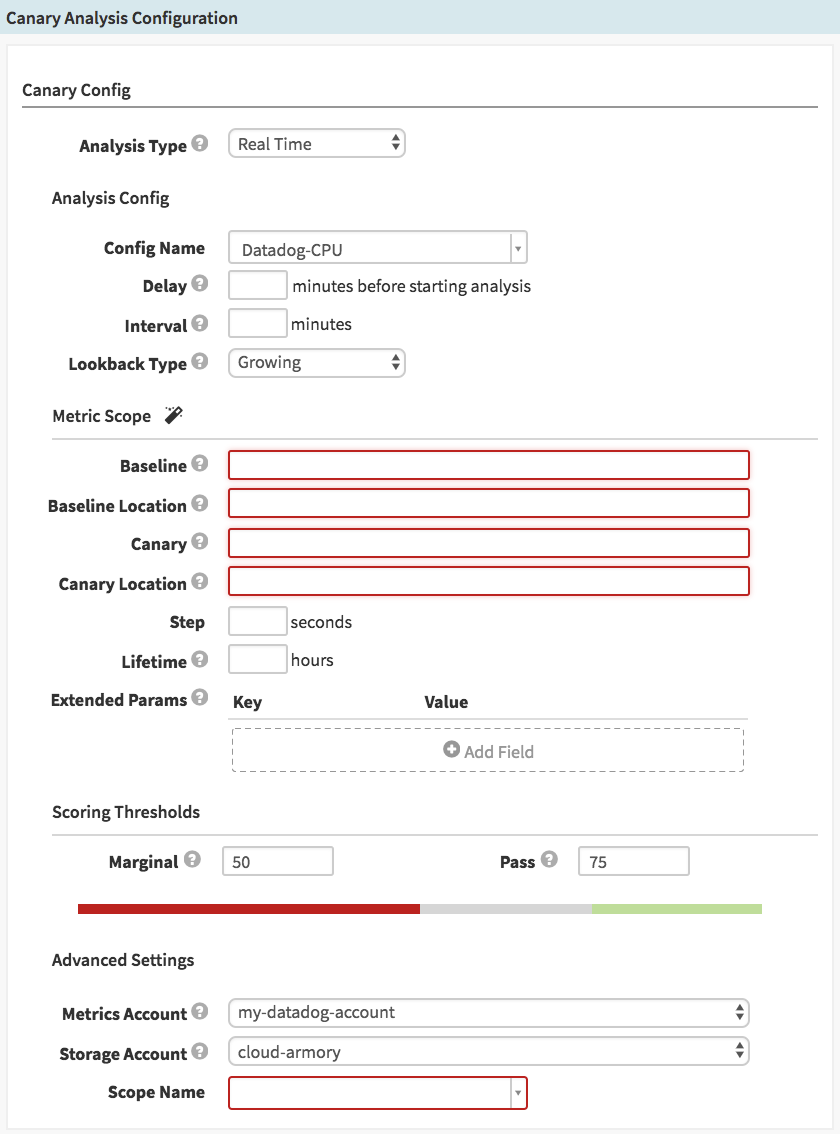
Analysis Type: “Real Time” (default) or “Retrospective”. If you select Retrospective, you’ll see two additional fields appear, where you will set the start and end time of the evaluation. This is the time period that will be examined on every execution of this stage, so it’s most useful for examining historical data, or just testing your configs before applying them to live systems.
Config Name: Here you select which Canary Config (which we created in the previous section) to use.
Delay: It may be useful to wait a few minutes after the previous deploy stages have completed, to let the systems get into a stable running state, before checking metrics. This field disappears if you’ve chosen to do a Retrospective analysis.
Interval: This defines the time between metrics inspections. If this is set to 30, for example, the metrics will be compared only twice during a 1-hour canary; if set to 5, it would be inspected 12 times during a 1-hour canary (see Lifetime, below).
Lookback Type: “Growing” (default) or “Sliding”. If set to “Growing”, the metrics are queried from the start of the canary up to the time of the interval. If set to “Sliding” (and you set the look back duration), it will only look at the metrics for that sliding window of time.
Metric Scopes: See below for details on this section.
Step: How many seconds between each metric datapoint to query. NOTE: For DataDog, this field is ignored (DataDog does not let you define the interval)
Lifetime: How many hours to let this canary analysis run before making a final determination. Note that if any single interval falls below a “Marginal” score, the analysis will stop immediately.
Scoring Thresholds: These are defaulted to whatever is configured in the Canary Config – however, you can adjust these scores on a per-pipeline basis if desired.
Metrics Account: Select which account to use for metrics (if you’ve configured multiple). NOTE: If you’ve configured multiple metrics providers, like DataDog AND Stackdriver, be sure you’ve selected an account that matches the Canary Config’s Metric Store. The UI currently does not prevent you from selecting, for example, a Stackdriver account here, after selecting a Canary Config based on Datadog.
Storage Account: Select which account to use for storing the metrics data and graphs.
Scope Name: Select Default for now.
Metric scopes
This section gets filled in differently, depending on which metrics provider
you’re using, and how you’ve set up your pipeline prior to this stage. For
DataDog, as an example, the intention is to provide the tag:value pairs
you’ve set up on your instances, identifying the different clusters, hosts,
etc. that you’re comparing. For example, if you’re using AWS Autoscaling
Groups to cluster your baseline and canary instances, you would enter
something like autoscaling_group:myapp-v001 for the baseline and
autoscaling_group:myapp-v002 for the canary. You can further refine
the results by appending further tag:value pairs separated by commas,
such as autoscaling_group:myapp-v001,region:us-west-2.
For DataDog, the two Location fields are unused and can be safely left blank. For Stackdriver (and other metrics sources) they are required fields.
For NewRelic, use the “Add Field” button in the “Extended Params” section to specify the _location_key and _scope_key for your application, both of which are appended to the NRQL query as ‘WHERE’ clauses and will differ between the canary and baseline. When using the Kubernetes V2 provider, its recommended to install the New Relic Kubernetes Metadata Injection service to provider Kubernetes specific attributes on Transactions to make it easier to differentiate between the canary and baseline.

After configuration (where you would set up your automated triggers, for example), the steps are:
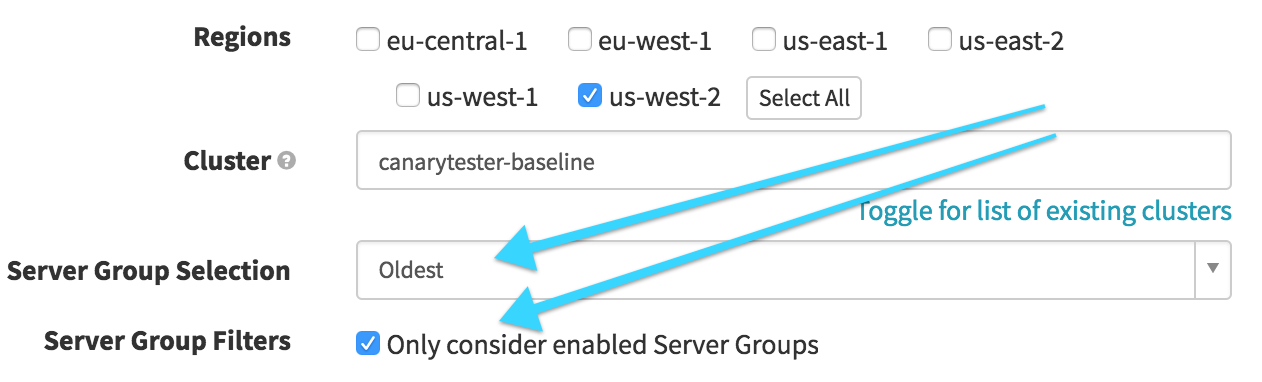
Identify Baseline (Find Image from Cluster Configuration)
In this stage, we want to find our baseline, based on what’s currently in production. We select our production cluster and then look for the “Oldest” enabled Server Group. This will later be referenced to act as our baseline server group for the canary.
Bake
This is where we actually bake the Canary image, otherwise just like any other bake stage.
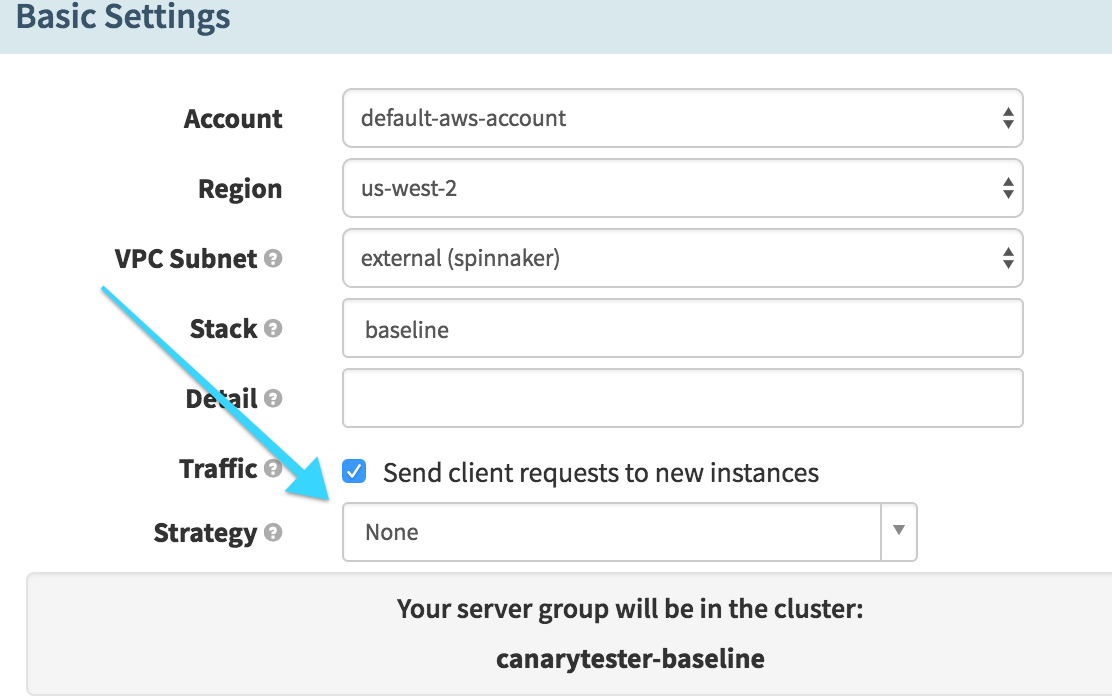
Deploy Canary (Deploy)
Here we deploy the baked image to our cluster. The important note here is that we select the “None” strategy – we don’t want Spinnaker to do anything to the existing server group yet, we want to run the new image alongside the old image.
Canary Analysis
We configure our canary analysis stage as described above. In this example, we can get the baseline server group name using SpEL:
${ #stage('Identify Baseline')['context']['artifacts'][0]['metadata']['sourceServerGroup'] }(For Datadog, we want to prepend
autoscaling_group:to this so we get the correct Datadog tag.)The canary server group can be retrieved with the SpEL:
${ deployedServerGroups[0].serverGroup }(again, we prepend
autoscaling_group:to construct the tag for Datadog)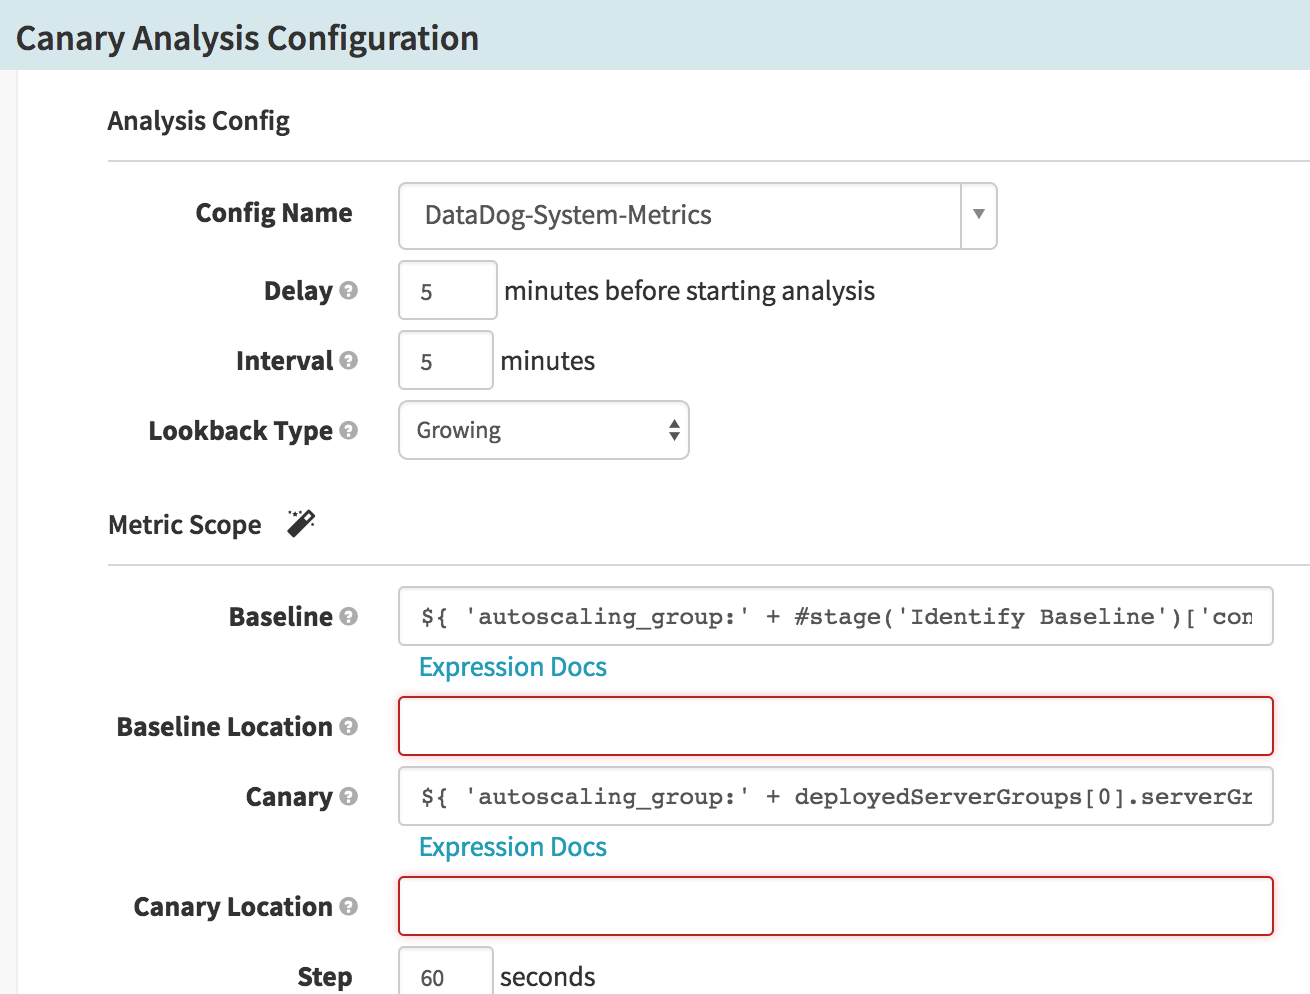
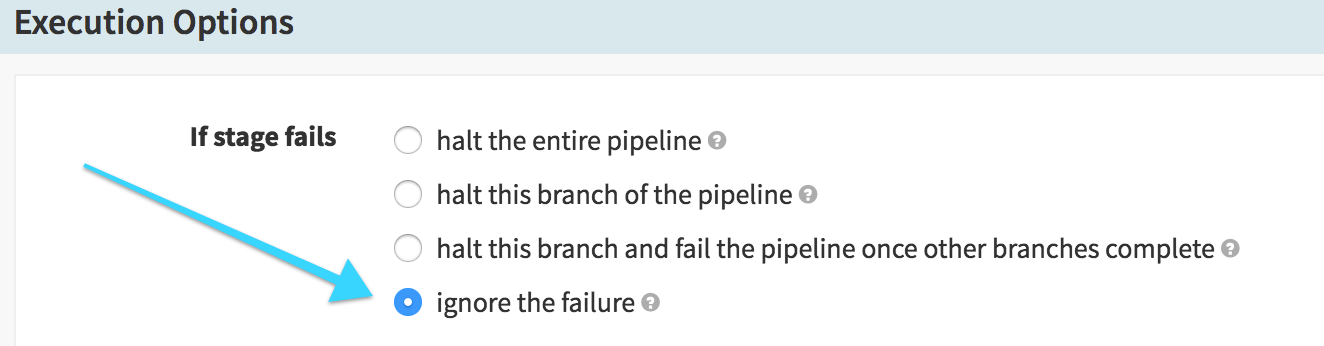
We also need to be sure that we don’t stop the pipeline execution if the canary fails – we want to be able to “clean up” after a failure, so we don’t keep the bad canary alive longer than we need to:
Destroy Canary on Failure (Destroy Server Group)
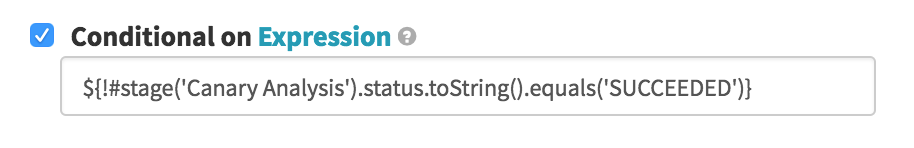
The first of two options after the Canary Analysis, we run this conditional on the Canary Analysis stage being in any state other than
SUCCEEDED– when the canary fails to pass its testing, we want to remove the failed canary server group. So here we destroy the “Newest Server Group” (the canary) and clean up, leaving the existing good cluster intact.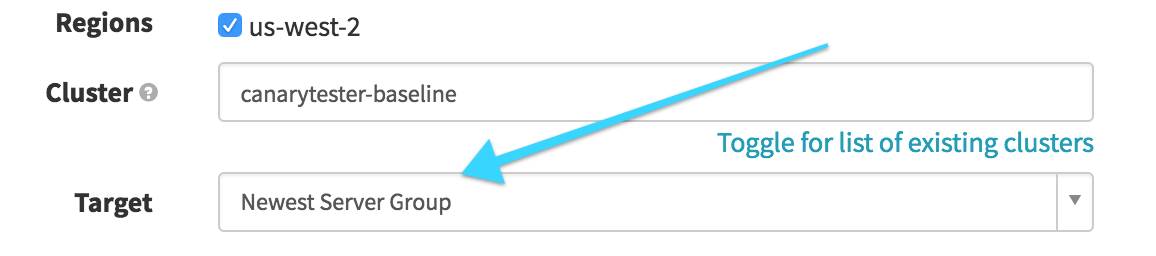
Promote Canary on Success (Destroy Server Group)
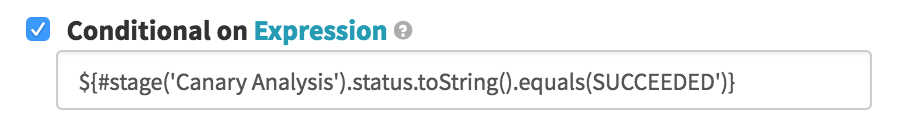
If our canary survives the coal mine, we want to deprecate the older code in favor of the cluster. In this simplistic version, we’re presuming both clusters are the same size, so all we need to do is remove the old cluster; a real production pipeline would probably need to resize the canary before removing the old cluster. It’s the same basic logic as the previous stage, except we are destroying the “Oldest Server Group” (the same way we ID’d the baseline in the first stage), conditional on the Canary Analysis stage ending with
SUCCEEDED: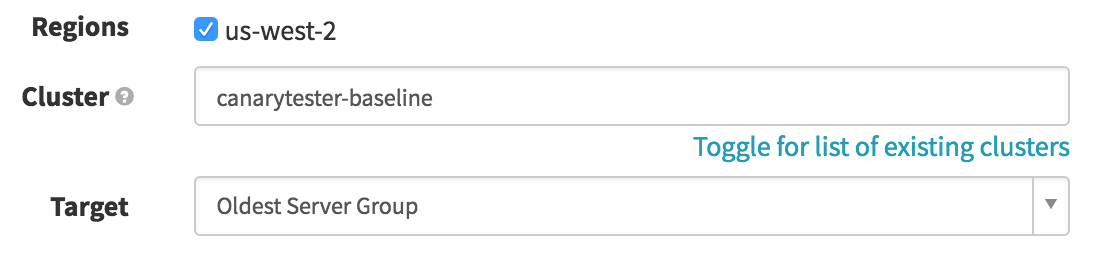
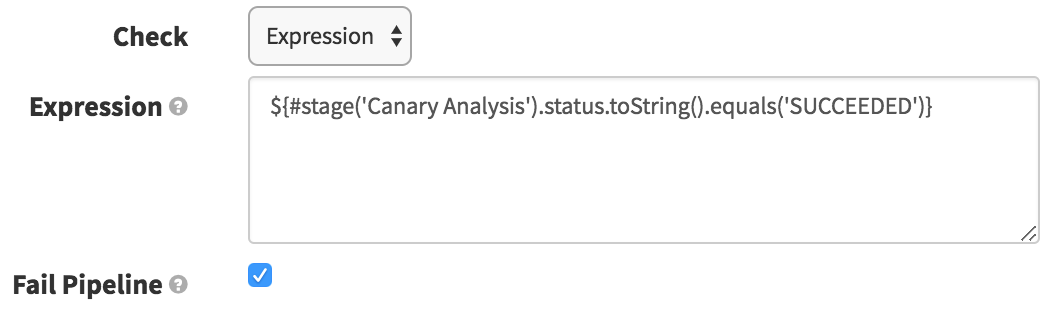
Check Preconditions
The purpose of this stage here is to simply fail the pipeline if the canary fails to pass. Since we are ignoring the failure on the Canary Analysis stage in order to proceed to our cleanup/promotion stages, we want this stage to fail if the canary failed. Here we just check that the Canary Analysis stage succeeded (and if it did not, it will fail the pipeline).
This should give you some idea of how you might want to integrate the Kayenta Canary Analysis stage into your production pipelines, and automate your deployments!
Feedback
Was this page helpful?
Thank you for letting us know!
Sorry to hear that. Please tell us how we can improve.
Last modified December 19, 2023: (13976a9f)